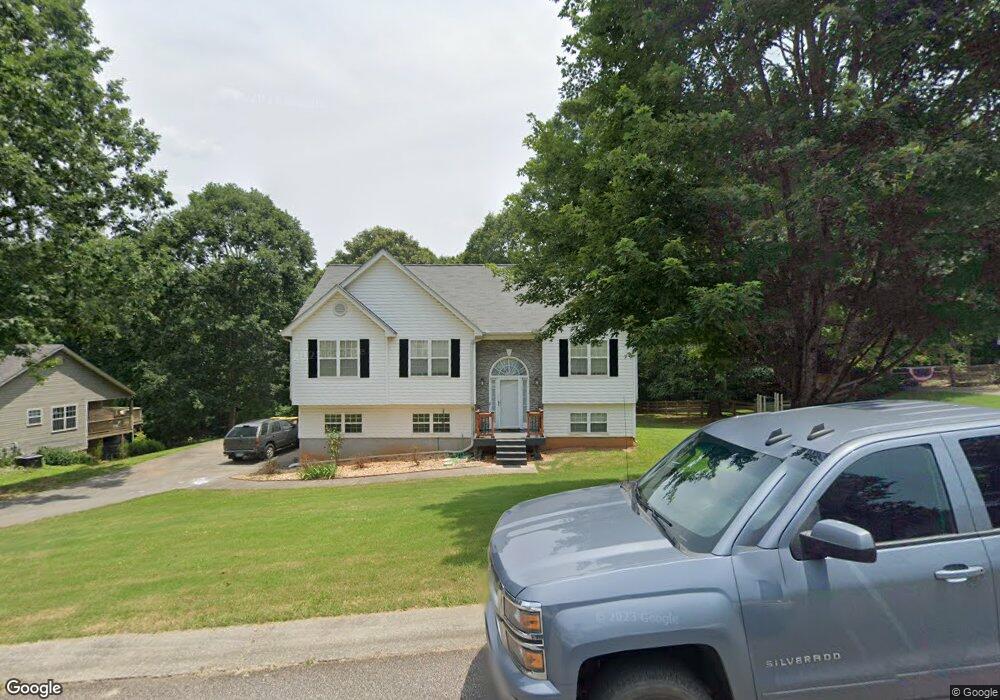
34 Chatham Ct Unit Lot 55 Jefferson, GA 30549
Estimated Value: $327,000 - $364,918
3
Beds
2
Baths
1,457
Sq Ft
$238/Sq Ft
Est. Value
About This Home
This home is located at 34 Chatham Ct Unit Lot 55, Jefferson, GA 30549 and is currently estimated at $347,230, approximately $238 per square foot. 34 Chatham Ct Unit Lot 55 is a home located in Jackson County with nearby schools including Gum Springs Elementary School, West Jackson Middle School, and Jackson County High School.
Ownership History
Date
Name
Owned For
Owner Type
Purchase Details
Closed on
Nov 15, 2024
Sold by
Prevatte Michael
Bought by
Damron Christal Victoria and Damron Michael Wayne
Current Estimated Value
Home Financials for this Owner
Home Financials are based on the most recent Mortgage that was taken out on this home.
Original Mortgage
$11,900
Outstanding Balance
$11,469
Interest Rate
5.63%
Mortgage Type
New Conventional
Estimated Equity
$335,761
Purchase Details
Closed on
Sep 29, 2020
Sold by
Prevatte Michael
Bought by
Prevatte Michael and Prevatte Donna
Home Financials for this Owner
Home Financials are based on the most recent Mortgage that was taken out on this home.
Original Mortgage
$235,172
Interest Rate
2.9%
Mortgage Type
New Conventional
Purchase Details
Closed on
Feb 21, 2003
Sold by
Millstone Communites
Bought by
Giles Henry C
Purchase Details
Closed on
Apr 30, 2001
Sold by
Wishbone Partners Ll
Bought by
Millstone Communites
Create a Home Valuation Report for This Property
The Home Valuation Report is an in-depth analysis detailing your home's value as well as a comparison with similar homes in the area
Home Values in the Area
Average Home Value in this Area
Purchase History
| Date | Buyer | Sale Price | Title Company |
|---|---|---|---|
| Damron Christal Victoria | $340,000 | -- | |
| Prevatte Michael | $227,000 | -- | |
| Prevatte Michael | $227,000 | -- | |
| Giles Henry C | $126,900 | -- | |
| Millstone Communites | $125,000 | -- |
Source: Public Records
Mortgage History
| Date | Status | Borrower | Loan Amount |
|---|---|---|---|
| Open | Damron Christal Victoria | $11,900 | |
| Closed | Damron Christal Victoria | $11,900 | |
| Open | Damron Christal Victoria | $333,841 | |
| Previous Owner | Prevatte Michael | $235,172 |
Source: Public Records
Tax History Compared to Growth
Tax History
| Year | Tax Paid | Tax Assessment Tax Assessment Total Assessment is a certain percentage of the fair market value that is determined by local assessors to be the total taxable value of land and additions on the property. | Land | Improvement |
|---|---|---|---|---|
| 2024 | $3,024 | $117,680 | $24,000 | $93,680 |
| 2023 | $3,050 | $100,680 | $24,000 | $76,680 |
| 2022 | $2,578 | $88,680 | $24,000 | $64,680 |
| 2021 | $2,268 | $77,480 | $12,800 | $64,680 |
| 2020 | $714 | $55,240 | $12,800 | $42,440 |
| 2019 | $725 | $55,240 | $12,800 | $42,440 |
| 2018 | $668 | $53,200 | $12,800 | $40,400 |
| 2017 | $649 | $52,606 | $12,800 | $39,806 |
| 2016 | $570 | $49,996 | $12,000 | $37,996 |
| 2015 | $512 | $46,187 | $10,000 | $36,187 |
| 2014 | $344 | $34,531 | $10,000 | $24,531 |
| 2013 | -- | $34,531 | $10,000 | $24,531 |
Source: Public Records
Map
Nearby Homes
- 34 Chatham Ct
- 0 Chatham Ct Unit 7488524
- 0 Chatham Ct Unit 7225247
- 60 Chatham Ct
- 12 Chatham Ct
- 189 Cabots Creek Dr
- 11 Hawthorne Dr
- 72 Chatham Ct
- 71 Chatham Ct
- 190 Cabots Creek Dr
- 87 Ashwick Dr
- 157 Cabots Creek Dr
- 33 Hawthorne Dr
- 63 Ashwick Dr
- 166 Cabots Creek Dr
- 107 Ashwick Dr
- 61 Hawthorne Dr Unit 51
- 61 Hawthorne Dr
- 0 Ashwick Dr Unit 8005694
- 0 Ashwick Dr Unit 7561445