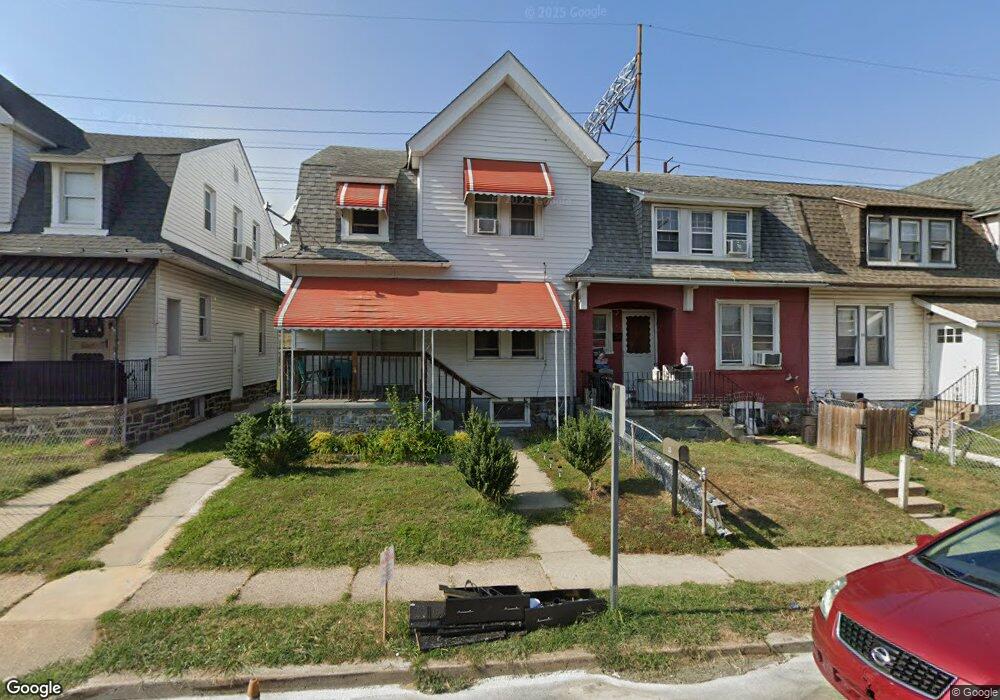
34 Chestnut St Marcus Hook, PA 19061
Estimated Value: $140,011 - $171,000
4
Beds
1
Bath
1,192
Sq Ft
$127/Sq Ft
Est. Value
About This Home
This home is located at 34 Chestnut St, Marcus Hook, PA 19061 and is currently estimated at $151,003, approximately $126 per square foot. 34 Chestnut St is a home located in Delaware County with nearby schools including Chichester Senior High School, Chester Charter School for the Arts, and Archmere Academy.
Ownership History
Date
Name
Owned For
Owner Type
Purchase Details
Closed on
Apr 15, 2013
Sold by
Marcus Hook Community Development Corp
Bought by
Hottle Michael Anthony and Newlin Donna
Current Estimated Value
Home Financials for this Owner
Home Financials are based on the most recent Mortgage that was taken out on this home.
Original Mortgage
$38,975
Interest Rate
3.52%
Mortgage Type
Seller Take Back
Purchase Details
Closed on
Oct 11, 2012
Sold by
Terrizzi Margaret
Bought by
Marcus Hook Community Development Corpor
Create a Home Valuation Report for This Property
The Home Valuation Report is an in-depth analysis detailing your home's value as well as a comparison with similar homes in the area
Home Values in the Area
Average Home Value in this Area
Purchase History
| Date | Buyer | Sale Price | Title Company |
|---|---|---|---|
| Hottle Michael Anthony | $30,000 | None Available | |
| Marcus Hook Community Development Corpor | $17,500 | None Available |
Source: Public Records
Mortgage History
| Date | Status | Borrower | Loan Amount |
|---|---|---|---|
| Closed | Hottle Michael Anthony | $38,975 |
Source: Public Records
Tax History
| Year | Tax Paid | Tax Assessment Tax Assessment Total Assessment is a certain percentage of the fair market value that is determined by local assessors to be the total taxable value of land and additions on the property. | Land | Improvement |
|---|---|---|---|---|
| 2025 | $2,717 | $66,230 | $18,620 | $47,610 |
| 2024 | $2,717 | $66,230 | $18,620 | $47,610 |
| 2023 | $2,514 | $66,230 | $18,620 | $47,610 |
| 2022 | $2,396 | $66,230 | $18,620 | $47,610 |
| 2021 | $3,367 | $66,230 | $18,620 | $47,610 |
| 2020 | $2,945 | $51,070 | $17,240 | $33,830 |
| 2019 | $2,945 | $51,070 | $17,240 | $33,830 |
| 2018 | $2,952 | $51,070 | $0 | $0 |
| 2017 | $2,932 | $51,070 | $0 | $0 |
| 2016 | $280 | $51,070 | $0 | $0 |
| 2015 | $286 | $51,070 | $0 | $0 |
| 2014 | $280 | $51,070 | $0 | $0 |
Source: Public Records
Map
Nearby Homes
- 12 Plaza St
- 4518 Post Rd
- 4412 Post Rd
- 1639 Huddle Ave
- 213 White Ave
- 332 White Ave
- 809 1/2 Market St
- 4211 W 5th St
- 217 Harvey Ave
- 4300 W 9th St Unit 101
- 13 W 8th St
- 119 Chadwick Ave
- 1539 Summit St
- 1542 Summit St
- 400 Market St
- 3418-3420-3422 W 4th St
- 0 9th & Chestnut Unit PADE2105654
- 1616 Ward St
- 308 Market St
- 222 Market St
Your Personal Tour Guide
Ask me questions while you tour the home.