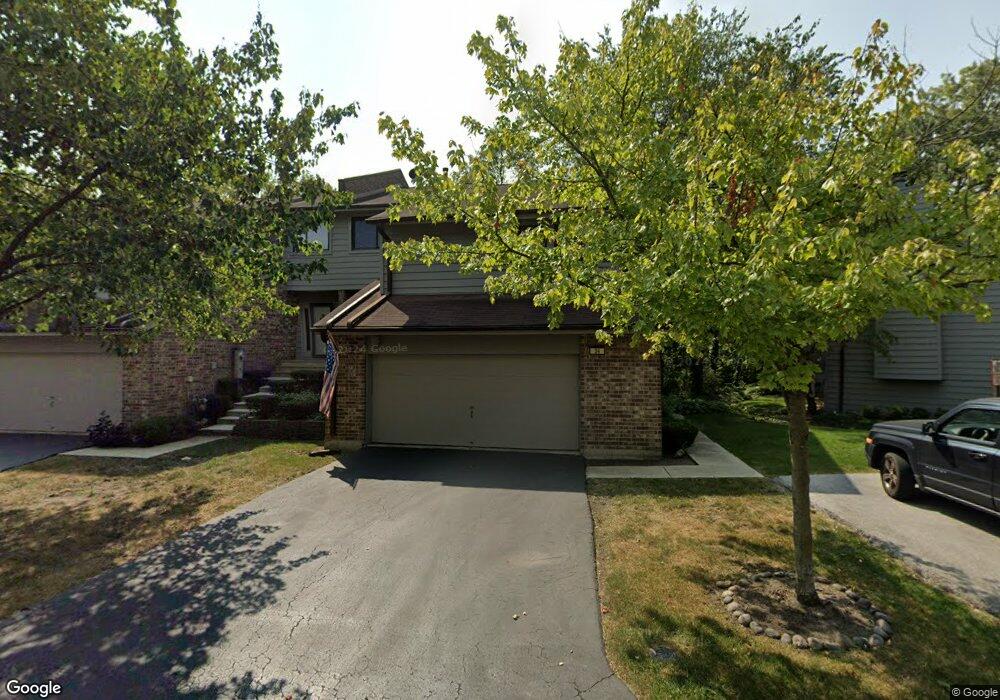
34 Commons Dr Palos Park, IL 60464
Ishnala NeighborhoodEstimated Value: $370,021 - $435,000
3
Beds
3
Baths
1,795
Sq Ft
$219/Sq Ft
Est. Value
About This Home
This home is located at 34 Commons Dr, Palos Park, IL 60464 and is currently estimated at $393,255, approximately $219 per square foot. 34 Commons Dr is a home located in Cook County with nearby schools including Palos East Elementary School, Palos South Middle School, and Amos Alonzo Stagg High School.
Ownership History
Date
Name
Owned For
Owner Type
Purchase Details
Closed on
Nov 27, 2023
Sold by
Mccormick Eileen R
Bought by
Mccormick Christopher N and Mccormick Eileen R
Current Estimated Value
Purchase Details
Closed on
Aug 1, 2018
Sold by
Buhe Buhe Nancy L Nancy L
Bought by
Mccormick Eileen R
Home Financials for this Owner
Home Financials are based on the most recent Mortgage that was taken out on this home.
Original Mortgage
$130,000
Interest Rate
4.75%
Mortgage Type
New Conventional
Purchase Details
Closed on
Feb 2, 1996
Sold by
Buhe James E and Buhe Nancy L
Bought by
Buhe James E and Buhe Nancy L
Purchase Details
Closed on
Mar 30, 1995
Sold by
Rawn Adrianne J
Bought by
Buhe James E and Buhe Nancy L
Purchase Details
Closed on
Mar 24, 1995
Sold by
Rawn Lloyd W and Rawn Adrianne J
Bought by
Rawn Adrianne J
Create a Home Valuation Report for This Property
The Home Valuation Report is an in-depth analysis detailing your home's value as well as a comparison with similar homes in the area
Home Values in the Area
Average Home Value in this Area
Purchase History
We collect this data history from publicly available records. To have your information removed, we recommend requesting removal directly through your county’s website.
| Date | Buyer | Sale Price | Title Company |
|---|---|---|---|
| Mccormick Christopher N | -- | None Listed On Document | |
| Mccormick Eileen R | $290,000 | Greater Illinois Title | |
| Buhe James E | -- | Attorneys Title Guaranty Fun | |
| Buhe James E | $222,000 | -- | |
| Rawn Adrianne J | -- | -- |
Source: Public Records
Mortgage History
We collect this data history from publicly available records. To have your information removed, we recommend requesting removal directly through your county’s website.
| Date | Status | Borrower | Loan Amount |
|---|---|---|---|
| Previous Owner | Mccormick Eileen R | $130,000 |
Source: Public Records
Tax History
| Year | Tax Paid | Tax Assessment Tax Assessment Total Assessment is a certain percentage of the fair market value that is determined by local assessors to be the total taxable value of land and additions on the property. | Land | Improvement |
|---|---|---|---|---|
| 2025 | $6,305 | $29,000 | $1,211 | $27,789 |
| 2024 | $6,305 | $29,000 | $1,211 | $27,789 |
| 2023 | $6,625 | $29,000 | $1,211 | $27,789 |
| 2022 | $6,625 | $25,433 | $3,794 | $21,639 |
| 2021 | $6,168 | $25,433 | $3,794 | $21,639 |
| 2020 | $6,006 | $25,433 | $3,794 | $21,639 |
| 2019 | $4,791 | $24,541 | $3,471 | $21,070 |
| 2018 | $3,477 | $24,541 | $3,471 | $21,070 |
| 2017 | $3,313 | $24,541 | $3,471 | $21,070 |
| 2016 | $4,372 | $20,685 | $2,986 | $17,699 |
| 2015 | $4,493 | $21,547 | $2,986 | $18,561 |
| 2014 | $4,466 | $21,547 | $2,986 | $18,561 |
| 2013 | $4,406 | $22,569 | $2,986 | $19,583 |
Source: Public Records
Map
Nearby Homes
- 126 Commons Dr
- 120 Commons Dr
- 11923 Southwest Hwy
- 19 Saint Moritz Dr Unit 201
- 12421 S 83rd Ave
- 8150 W Brookside Dr Unit 204
- 10 Deerpath Ln
- 8002 W 127th St
- 11714 S 82nd Ct
- 12132 S Harold Ave
- 7909 W 127th St
- 11742 Lighthouse Ln
- 11733 Seagull Ln
- 11720 Seagull Ln
- 8609 W 121st St
- 12212 S Richard Ave
- 11904 S 86th Ave
- 12735 S 84th Ave
- 18 Moorings Dr
- 8623 W Algoma Rd
Your Personal Tour Guide
Ask me questions while you tour the home.