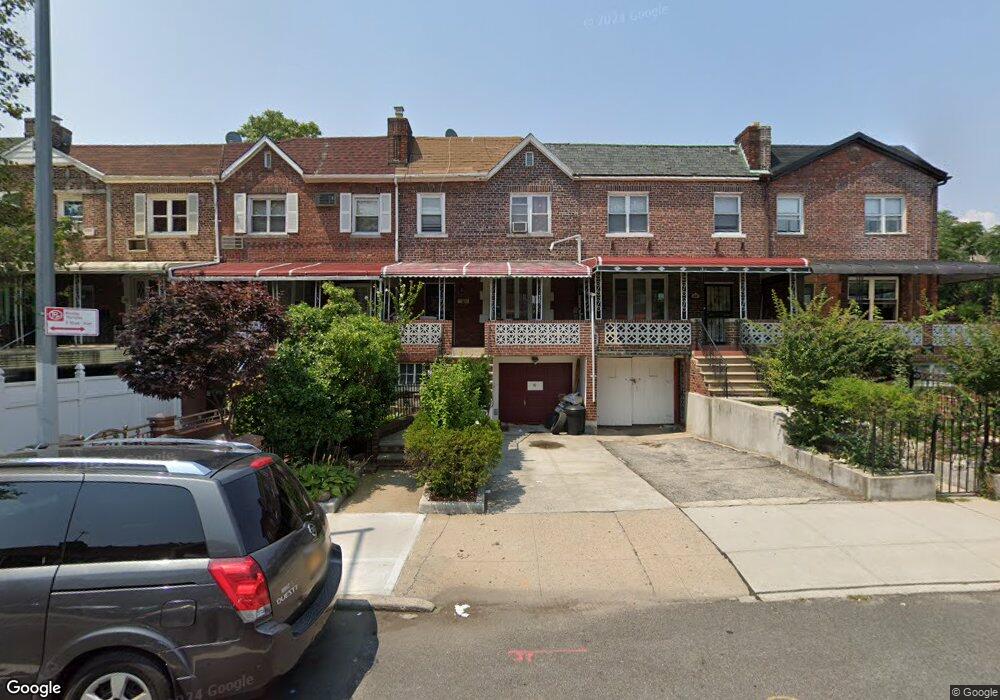
34 E 54th St Brooklyn, NY 11203
East Flatbush NeighborhoodEstimated Value: $794,000 - $826,000
Studio
--
Bath
1,980
Sq Ft
$408/Sq Ft
Est. Value
About This Home
This home is located at 34 E 54th St, Brooklyn, NY 11203 and is currently estimated at $807,314, approximately $407 per square foot. 34 E 54th St is a home located in Kings County with nearby schools including P.S. 268 Emma Lazarus, East Flatbush Community Research School, and Kings Elementary School.
Ownership History
Date
Name
Owned For
Owner Type
Purchase Details
Closed on
May 13, 2025
Sold by
Jeremiah Dawne
Bought by
David Chana and Friedman Shneur Zalman
Current Estimated Value
Home Financials for this Owner
Home Financials are based on the most recent Mortgage that was taken out on this home.
Original Mortgage
$720,000
Outstanding Balance
$716,132
Interest Rate
6.62%
Mortgage Type
Purchase Money Mortgage
Estimated Equity
$91,182
Purchase Details
Closed on
Nov 15, 2004
Sold by
Jeremiah Dawne Y and Jeremiah Jan J
Bought by
Jeremiah Dawne Y
Purchase Details
Closed on
Aug 28, 1997
Sold by
Howard Real Estate Ltd
Bought by
Jeremiah Dawne Y and Jeremiah Jan J
Home Financials for this Owner
Home Financials are based on the most recent Mortgage that was taken out on this home.
Original Mortgage
$197,100
Interest Rate
7.48%
Mortgage Type
FHA
Purchase Details
Closed on
Apr 30, 1997
Sold by
Federal Home Loan Mortgage Corporation
Bought by
Howard Real Estate Ltd
Create a Home Valuation Report for This Property
The Home Valuation Report is an in-depth analysis detailing your home's value as well as a comparison with similar homes in the area
Home Values in the Area
Average Home Value in this Area
Purchase History
| Date | Buyer | Sale Price | Title Company |
|---|---|---|---|
| David Chana | $800,000 | -- | |
| David Chana | $800,000 | -- | |
| Jeremiah Dawne Y | -- | -- | |
| Jeremiah Dawne Y | -- | -- | |
| Jeremiah Dawne Y | $200,000 | -- | |
| Jeremiah Dawne Y | $200,000 | -- | |
| Howard Real Estate Ltd | $129,000 | -- | |
| Howard Real Estate Ltd | $129,000 | -- |
Source: Public Records
Mortgage History
| Date | Status | Borrower | Loan Amount |
|---|---|---|---|
| Open | David Chana | $720,000 | |
| Closed | David Chana | $720,000 | |
| Previous Owner | Jeremiah Dawne Y | $197,100 | |
| Closed | Jeremiah Dawne Y | $0 |
Source: Public Records
Tax History
| Year | Tax Paid | Tax Assessment Tax Assessment Total Assessment is a certain percentage of the fair market value that is determined by local assessors to be the total taxable value of land and additions on the property. | Land | Improvement |
|---|---|---|---|---|
| 2025 | $6,457 | $52,920 | $18,300 | $34,620 |
| 2024 | $6,457 | $43,380 | $18,300 | $25,080 |
| 2023 | $6,143 | $47,220 | $18,300 | $28,920 |
| 2022 | $5,674 | $40,140 | $18,300 | $21,840 |
| 2021 | $5,988 | $39,300 | $18,300 | $21,000 |
| 2020 | $2,952 | $35,460 | $18,300 | $17,160 |
| 2019 | $5,555 | $35,460 | $18,300 | $17,160 |
| 2018 | $5,079 | $26,374 | $12,024 | $14,350 |
| 2017 | $4,773 | $24,883 | $16,286 | $8,597 |
| 2016 | $4,664 | $24,883 | $16,392 | $8,491 |
| 2015 | $2,611 | $24,693 | $14,933 | $9,760 |
| 2014 | $2,611 | $23,296 | $13,603 | $9,693 |
Source: Public Records
Map
Nearby Homes
- 61 E 54th St
- 210 Remsen Ave Unit 2F
- 76 E 54th St
- 26 E 55th St
- 52 E 55th St Unit 2FAM
- 234 E 92nd St
- 187 E 91st St
- 157 Remsen Ave
- 197 E 52nd St
- 1017 Winthrop St
- 895 Lenox Rd
- 27 E 56th St
- 243 E 51st St
- 234 E 93rd St
- 323 E 91st St
- 660 Utica Ave
- 336 E 91st St Unit 4
- 828 Lenox Rd
- 206 E 53rd St
- 103 Remsen Ave
Your Personal Tour Guide
Ask me questions while you tour the home.