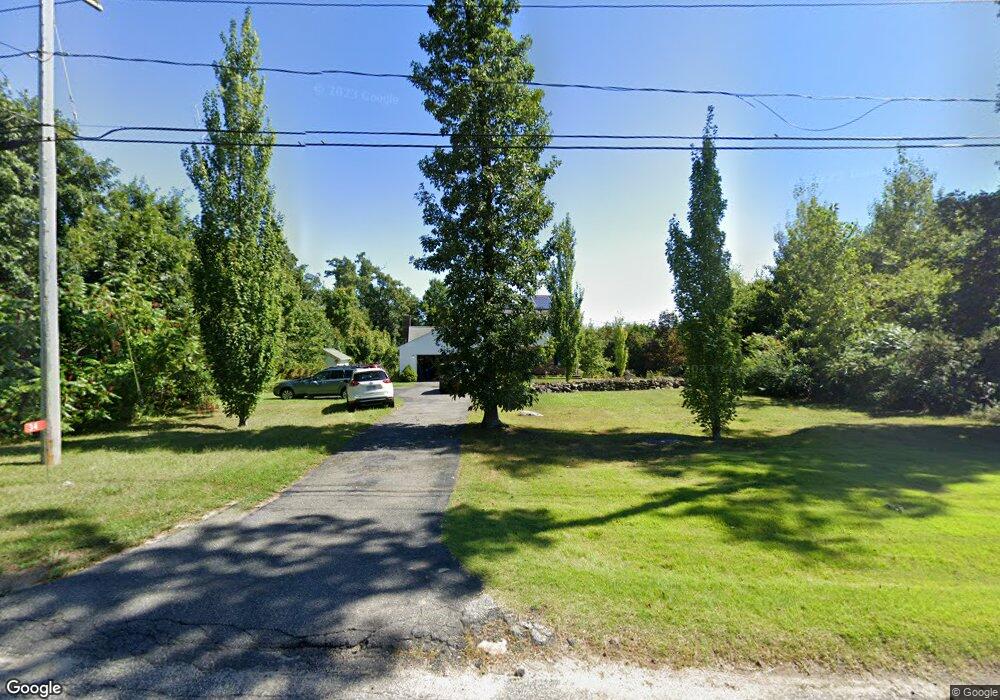
34 E Hill Rd Monson, MA 01057
Estimated Value: $411,000 - $494,000
3
Beds
3
Baths
1,824
Sq Ft
$244/Sq Ft
Est. Value
About This Home
This home is located at 34 E Hill Rd, Monson, MA 01057 and is currently estimated at $445,129, approximately $244 per square foot. 34 E Hill Rd is a home located in Hampden County with nearby schools including Quarry Hill Community School, Granite Valley School, and Monson High School.
Ownership History
Date
Name
Owned For
Owner Type
Purchase Details
Closed on
Oct 9, 2025
Sold by
Talbot-Olson Gail S
Bought by
Talbot-Olson Gail S and Talbot-Olson Thomas P
Current Estimated Value
Purchase Details
Closed on
Aug 8, 2008
Sold by
Talbot Elise G
Bought by
Talbot-Olson Gail S
Create a Home Valuation Report for This Property
The Home Valuation Report is an in-depth analysis detailing your home's value as well as a comparison with similar homes in the area
Home Values in the Area
Average Home Value in this Area
Purchase History
| Date | Buyer | Sale Price | Title Company |
|---|---|---|---|
| Talbot-Olson Gail S | -- | -- | |
| Talbot-Olson Gail S | -- | -- | |
| Talbot-Olson Gail S | -- | -- |
Source: Public Records
Mortgage History
| Date | Status | Borrower | Loan Amount |
|---|---|---|---|
| Previous Owner | Talbot-Olson Gail S | $19,500 |
Source: Public Records
Tax History Compared to Growth
Tax History
| Year | Tax Paid | Tax Assessment Tax Assessment Total Assessment is a certain percentage of the fair market value that is determined by local assessors to be the total taxable value of land and additions on the property. | Land | Improvement |
|---|---|---|---|---|
| 2025 | $5,157 | $346,800 | $68,800 | $278,000 |
| 2024 | $5,079 | $327,700 | $68,800 | $258,900 |
| 2023 | $4,978 | $313,900 | $68,800 | $245,100 |
| 2022 | $4,791 | $268,700 | $68,800 | $199,900 |
| 2021 | $4,544 | $250,800 | $68,800 | $182,000 |
| 2020 | $4,582 | $250,800 | $68,800 | $182,000 |
| 2019 | $4,403 | $240,100 | $68,800 | $171,300 |
| 2018 | $4,199 | $238,600 | $76,200 | $162,400 |
| 2017 | $4,008 | $230,200 | $73,100 | $157,100 |
| 2016 | $3,902 | $227,900 | $70,500 | $157,400 |
| 2015 | $3,799 | $227,900 | $70,500 | $157,400 |
| 2014 | $3,692 | $227,900 | $70,500 | $157,400 |
Source: Public Records
Map
Nearby Homes