34 Empire Dr North Andover, MA 01845
Estimated Value: $360,000 - $802,000
3
Beds
3
Baths
1,696
Sq Ft
$295/Sq Ft
Est. Value
About This Home
This home is located at 34 Empire Dr, North Andover, MA 01845 and is currently estimated at $500,734, approximately $295 per square foot. 34 Empire Dr is a home with nearby schools including Franklin Elementary School, North Andover Middle School, and North Andover High School.
Ownership History
Date
Name
Owned For
Owner Type
Purchase Details
Closed on
Jan 5, 2021
Sold by
Small Kevin and Small Lauren E
Bought by
Riaz Muhammad U and Khan Sadia N
Current Estimated Value
Home Financials for this Owner
Home Financials are based on the most recent Mortgage that was taken out on this home.
Original Mortgage
$234,093
Outstanding Balance
$208,929
Interest Rate
2.71%
Mortgage Type
Purchase Money Mortgage
Estimated Equity
$291,805
Purchase Details
Closed on
Nov 16, 2012
Sold by
Orchard Village Llc
Bought by
Martino Tammi L
Create a Home Valuation Report for This Property
The Home Valuation Report is an in-depth analysis detailing your home's value as well as a comparison with similar homes in the area
Home Values in the Area
Average Home Value in this Area
Purchase History
| Date | Buyer | Sale Price | Title Company |
|---|---|---|---|
| Riaz Muhammad U | $244,093 | None Available | |
| Martino Tammi L | $200,400 | -- |
Source: Public Records
Mortgage History
| Date | Status | Borrower | Loan Amount |
|---|---|---|---|
| Open | Riaz Muhammad U | $234,093 |
Source: Public Records
Tax History Compared to Growth
Tax History
| Year | Tax Paid | Tax Assessment Tax Assessment Total Assessment is a certain percentage of the fair market value that is determined by local assessors to be the total taxable value of land and additions on the property. | Land | Improvement |
|---|---|---|---|---|
| 2025 | $2,606 | $231,400 | $188,600 | $42,800 |
| 2024 | $2,566 | $231,400 | $188,600 | $42,800 |
| 2023 | $2,832 | $231,400 | $188,600 | $42,800 |
| 2022 | $2,982 | $220,400 | $188,600 | $31,800 |
| 2021 | $3,123 | $220,400 | $188,600 | $31,800 |
| 2020 | $3,028 | $220,400 | $188,600 | $31,800 |
| 2019 | $2,646 | $197,300 | $93,800 | $103,500 |
| 2018 | $7,233 | $497,800 | $234,600 | $263,200 |
| 2017 | $2,719 | $190,400 | $188,600 | $1,800 |
| 2016 | $2,717 | $190,400 | $188,600 | $1,800 |
| 2015 | $2,740 | $190,400 | $188,600 | $1,800 |
Source: Public Records
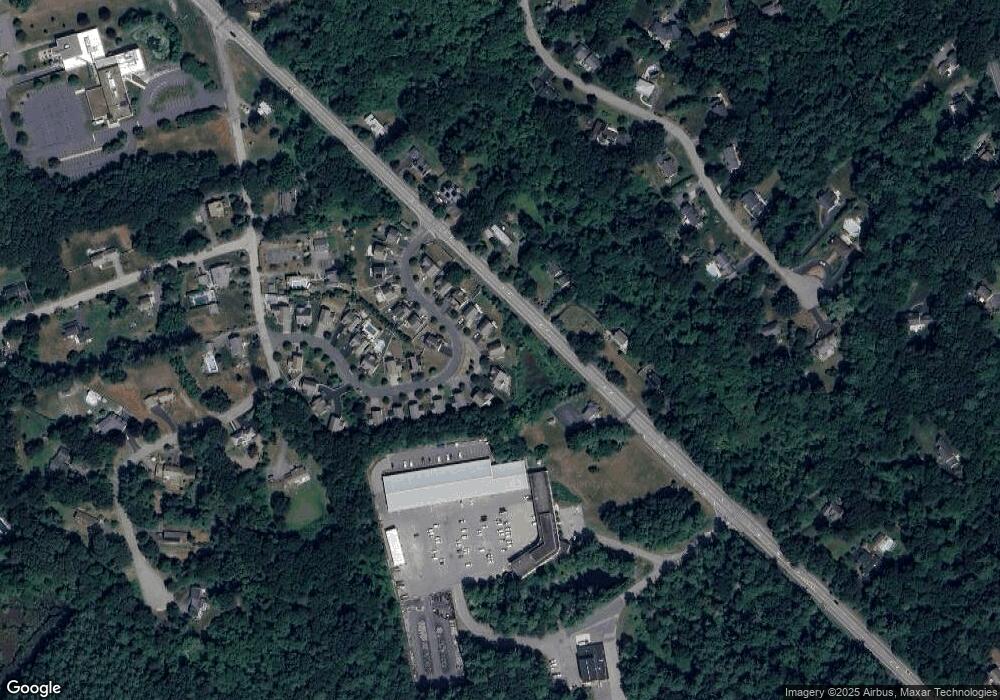
Map
Nearby Homes