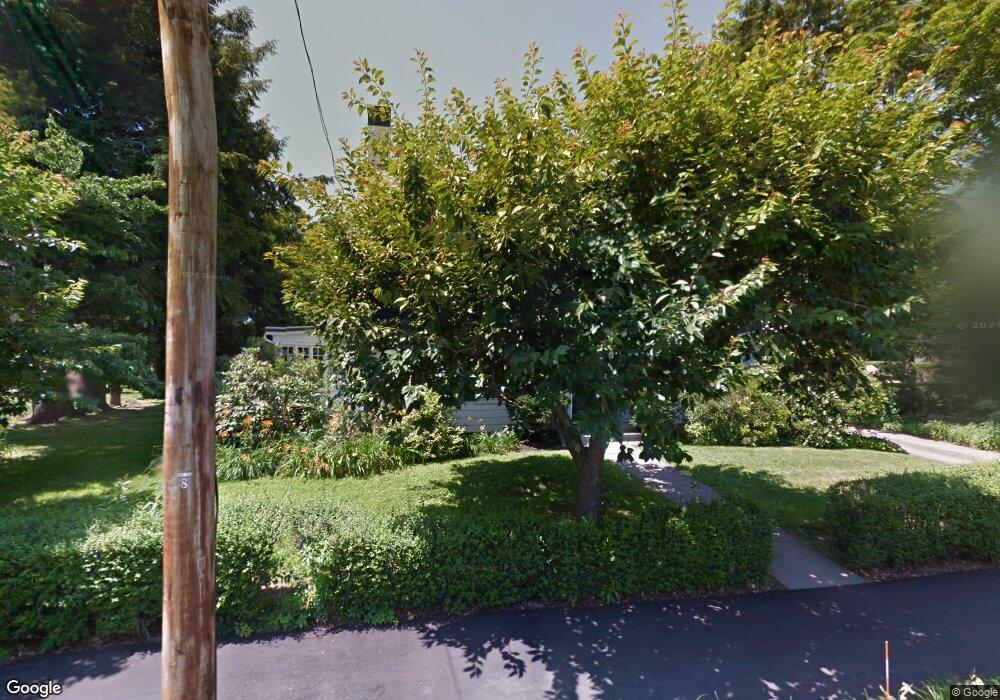
34 Fearing Rd Hingham, MA 02043
Crow Point NeighborhoodEstimated Value: $1,900,175 - $2,229,000
5
Beds
5
Baths
3,402
Sq Ft
$601/Sq Ft
Est. Value
About This Home
This home is located at 34 Fearing Rd, Hingham, MA 02043 and is currently estimated at $2,044,725, approximately $601 per square foot. 34 Fearing Rd is a home located in Plymouth County with nearby schools including William L. Foster Elementary School, St. Paul Elementary School, and Derby Academy.
Ownership History
Date
Name
Owned For
Owner Type
Purchase Details
Closed on
May 8, 2025
Sold by
Bright Kathleen F Est and Bright
Bought by
Kathleen F Bright 2002 T F and Kathleen Bright
Current Estimated Value
Home Financials for this Owner
Home Financials are based on the most recent Mortgage that was taken out on this home.
Original Mortgage
$1,000,000
Outstanding Balance
$994,842
Interest Rate
6.83%
Mortgage Type
New Conventional
Estimated Equity
$1,049,883
Purchase Details
Closed on
Sep 29, 2020
Sold by
Bright Kathleen F
Bought by
Kathleen F Bright 2002 T F and Kathleen Bright
Create a Home Valuation Report for This Property
The Home Valuation Report is an in-depth analysis detailing your home's value as well as a comparison with similar homes in the area
Home Values in the Area
Average Home Value in this Area
Purchase History
| Date | Buyer | Sale Price | Title Company |
|---|---|---|---|
| Kathleen F Bright 2002 T F | -- | None Available | |
| Kathleen F Bright 2002 T F | -- | None Available | |
| Kathleen F Bright 2002 T F | -- | None Available | |
| Kathleen F Bright 2002 T F | -- | None Available |
Source: Public Records
Mortgage History
| Date | Status | Borrower | Loan Amount |
|---|---|---|---|
| Open | Kathleen F Bright 2002 T F | $1,000,000 |
Source: Public Records
Tax History Compared to Growth
Tax History
| Year | Tax Paid | Tax Assessment Tax Assessment Total Assessment is a certain percentage of the fair market value that is determined by local assessors to be the total taxable value of land and additions on the property. | Land | Improvement |
|---|---|---|---|---|
| 2025 | $16,824 | $1,573,800 | $771,600 | $802,200 |
| 2024 | $16,329 | $1,505,000 | $771,600 | $733,400 |
| 2023 | $14,401 | $1,440,100 | $771,600 | $668,500 |
| 2022 | $14,303 | $1,237,300 | $701,500 | $535,800 |
| 2021 | $13,600 | $1,152,500 | $662,500 | $490,000 |
| 2020 | $13,168 | $1,142,100 | $662,500 | $479,600 |
| 2019 | $13,135 | $1,112,200 | $662,500 | $449,700 |
| 2018 | $13,091 | $1,112,200 | $662,500 | $449,700 |
| 2017 | $13,393 | $1,093,300 | $686,500 | $406,800 |
| 2016 | $13,247 | $1,060,600 | $653,800 | $406,800 |
| 2015 | $12,684 | $1,012,300 | $605,500 | $406,800 |
Source: Public Records
Map
Nearby Homes