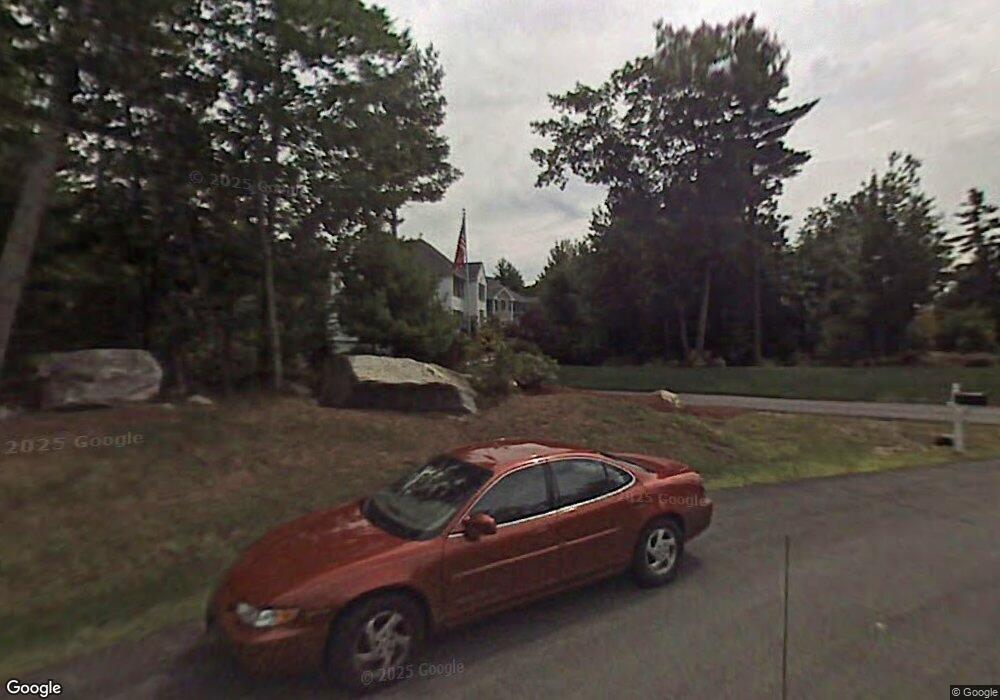
34 Fletcher Rd Windham, NH 03087
Estimated Value: $1,160,440 - $1,248,000
4
Beds
4
Baths
3,901
Sq Ft
$312/Sq Ft
Est. Value
About This Home
This home is located at 34 Fletcher Rd, Windham, NH 03087 and is currently estimated at $1,216,360, approximately $311 per square foot. 34 Fletcher Rd is a home located in Rockingham County with nearby schools including Golden Brook Elementary School, Windham Middle School, and Windham High School.
Ownership History
Date
Name
Owned For
Owner Type
Purchase Details
Closed on
Feb 11, 2020
Sold by
Parker Joseph M and Parker Cindy O
Bought by
P5 Ft
Current Estimated Value
Purchase Details
Closed on
Apr 6, 2001
Sold by
Thomas Mesiti and Thomas Marblehe
Bought by
Parker Joseph M
Create a Home Valuation Report for This Property
The Home Valuation Report is an in-depth analysis detailing your home's value as well as a comparison with similar homes in the area
Home Values in the Area
Average Home Value in this Area
Purchase History
| Date | Buyer | Sale Price | Title Company |
|---|---|---|---|
| P5 Ft | -- | None Available | |
| Parker Joseph M | $100,000 | -- |
Source: Public Records
Mortgage History
| Date | Status | Borrower | Loan Amount |
|---|---|---|---|
| Previous Owner | Parker Joseph M | $39,000 | |
| Previous Owner | Parker Joseph M | $341,600 | |
| Previous Owner | Parker Joseph M | $293,000 |
Source: Public Records
Tax History
| Year | Tax Paid | Tax Assessment Tax Assessment Total Assessment is a certain percentage of the fair market value that is determined by local assessors to be the total taxable value of land and additions on the property. | Land | Improvement |
|---|---|---|---|---|
| 2025 | $15,482 | $1,094,100 | $301,200 | $792,900 |
| 2024 | $15,289 | $675,300 | $188,300 | $487,000 |
| 2023 | $14,276 | $667,100 | $188,300 | $478,800 |
| 2022 | $12,972 | $656,500 | $188,300 | $468,200 |
| 2021 | $12,243 | $657,500 | $188,300 | $469,200 |
| 2020 | $12,578 | $657,500 | $188,300 | $469,200 |
| 2019 | $11,331 | $502,500 | $158,800 | $343,700 |
| 2018 | $9,744 | $502,500 | $158,800 | $343,700 |
| 2017 | $10,151 | $502,500 | $158,800 | $343,700 |
| 2016 | $10,851 | $497,300 | $158,800 | $338,500 |
| 2015 | $10,645 | $490,100 | $158,800 | $331,300 |
| 2014 | $9,314 | $388,100 | $153,000 | $235,100 |
| 2013 | $9,870 | $418,200 | $153,000 | $265,200 |
Source: Public Records
Map
Nearby Homes
Your Personal Tour Guide
Ask me questions while you tour the home.