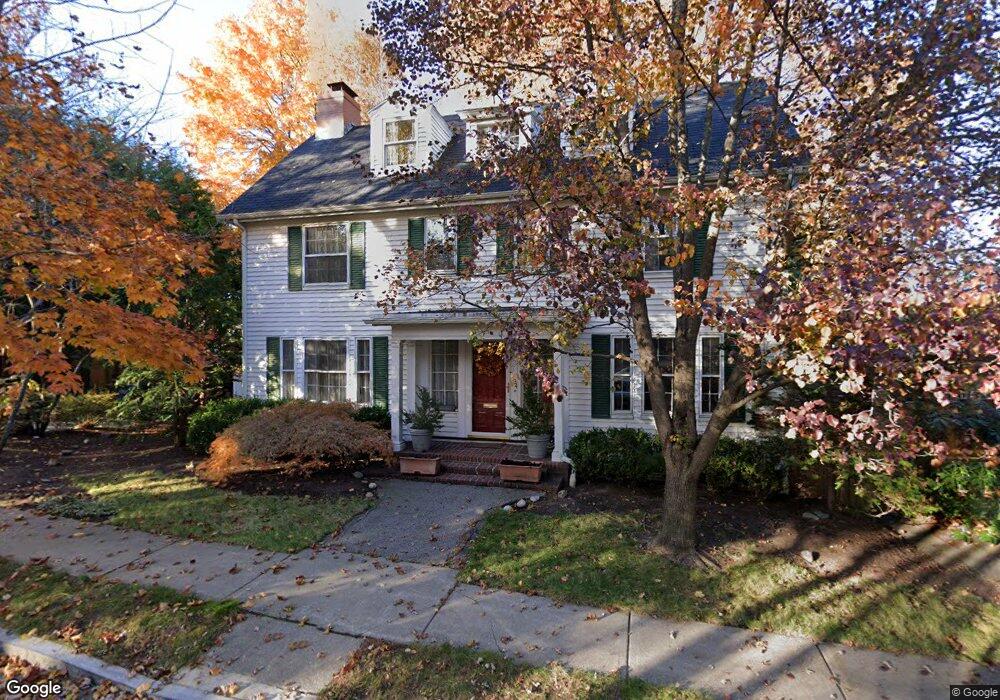
34 Glendale Rd Belmont, MA 02478
Belmont Center NeighborhoodEstimated Value: $1,651,000 - $2,036,000
5
Beds
3
Baths
2,016
Sq Ft
$893/Sq Ft
Est. Value
About This Home
This home is located at 34 Glendale Rd, Belmont, MA 02478 and is currently estimated at $1,799,959, approximately $892 per square foot. 34 Glendale Rd is a home located in Middlesex County with nearby schools including Roger Wellington Elementary School, Winthrop L Chenery Middle School, and Belmont High School.
Ownership History
Date
Name
Owned For
Owner Type
Purchase Details
Closed on
Jun 30, 1999
Sold by
Garrett Lauren A and Garrett Van E
Bought by
Thompson Lester W
Current Estimated Value
Home Financials for this Owner
Home Financials are based on the most recent Mortgage that was taken out on this home.
Original Mortgage
$240,000
Outstanding Balance
$65,263
Interest Rate
7.19%
Mortgage Type
Purchase Money Mortgage
Estimated Equity
$1,734,696
Purchase Details
Closed on
Nov 30, 1995
Sold by
Gustafson Philip E and Gustafson Helenp
Bought by
Garrett Lauren A
Create a Home Valuation Report for This Property
The Home Valuation Report is an in-depth analysis detailing your home's value as well as a comparison with similar homes in the area
Home Values in the Area
Average Home Value in this Area
Purchase History
| Date | Buyer | Sale Price | Title Company |
|---|---|---|---|
| Thompson Lester W | $522,500 | -- | |
| Garrett Lauren A | $295,000 | -- |
Source: Public Records
Mortgage History
| Date | Status | Borrower | Loan Amount |
|---|---|---|---|
| Open | Garrett Lauren A | $20,000 | |
| Open | Garrett Lauren A | $240,000 | |
| Previous Owner | Garrett Lauren A | $181,500 | |
| Previous Owner | Garrett Lauren A | $210,000 |
Source: Public Records
Tax History
| Year | Tax Paid | Tax Assessment Tax Assessment Total Assessment is a certain percentage of the fair market value that is determined by local assessors to be the total taxable value of land and additions on the property. | Land | Improvement |
|---|---|---|---|---|
| 2025 | $16,880 | $1,482,000 | $898,000 | $584,000 |
| 2024 | $16,315 | $1,545,000 | $1,119,000 | $426,000 |
| 2023 | $14,320 | $1,274,000 | $854,000 | $420,000 |
| 2022 | $13,548 | $1,172,000 | $781,000 | $391,000 |
| 2021 | $13,617 | $1,180,000 | $855,000 | $325,000 |
| 2020 | $14,619 | $1,329,000 | $912,000 | $417,000 |
| 2019 | $12,545 | $1,075,000 | $711,000 | $364,000 |
| 2018 | $6,299 | $926,000 | $575,000 | $351,000 |
| 2017 | $5,106 | $873,000 | $527,000 | $346,000 |
| 2016 | $10,940 | $871,000 | $527,000 | $344,000 |
| 2015 | $10,139 | $786,000 | $450,000 | $336,000 |
Source: Public Records
Map
Nearby Homes
- 207 Slade St
- 51 Gale Rd
- 15 Wiley Rd Unit 15
- 6 Shaw Rd
- 9 Henry St Unit 9
- 156 Waverley St Unit 156
- 156 Waverley St Unit 158
- 23 Centre Ave
- 21 Wellington Ln
- 92 Shaw Rd
- 314 Channing Rd
- 125 Trapelo Rd Unit 21
- 125 Trapelo Rd Unit 36
- 9 Harriet Ave Unit 1
- 11 Harriet Ave Unit 2
- 27-29 S Normandy Ave
- 519 Belmont St
- 519 Belmont St Unit 2
- 99 Beech St
- 589-591 Belmont St
Your Personal Tour Guide
Ask me questions while you tour the home.