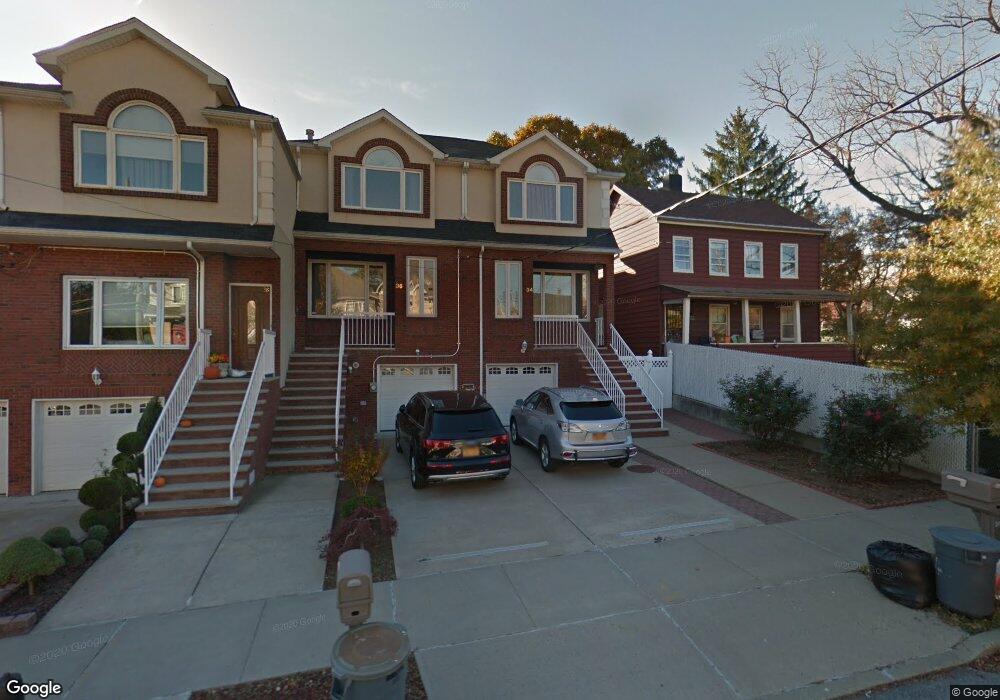
34 Grasmere Ave Staten Island, NY 10304
Concord NeighborhoodEstimated Value: $774,000 - $919,000
4
Beds
4
Baths
1,800
Sq Ft
$471/Sq Ft
Est. Value
About This Home
This home is located at 34 Grasmere Ave, Staten Island, NY 10304 and is currently estimated at $848,266, approximately $471 per square foot. 34 Grasmere Ave is a home located in Richmond County with nearby schools including P.S. 48 - William C. Wilcox, I.S. 49 Berta A Dreyfus, and New Dorp High School.
Ownership History
Date
Name
Owned For
Owner Type
Purchase Details
Closed on
Aug 26, 2008
Sold by
Gelt Venture Llc
Bought by
Tong Fang Cai and Xu Man Qin
Current Estimated Value
Home Financials for this Owner
Home Financials are based on the most recent Mortgage that was taken out on this home.
Original Mortgage
$150,000
Interest Rate
6.69%
Mortgage Type
Purchase Money Mortgage
Purchase Details
Closed on
Jun 28, 2004
Sold by
Koch James J and Koch Madeline M
Bought by
Gelt Venture Llc
Home Financials for this Owner
Home Financials are based on the most recent Mortgage that was taken out on this home.
Original Mortgage
$282,500
Interest Rate
7%
Mortgage Type
Purchase Money Mortgage
Purchase Details
Closed on
Mar 6, 1998
Sold by
Koch Madeline M and Segali George
Bought by
Koch Madeline M and Koch James J
Create a Home Valuation Report for This Property
The Home Valuation Report is an in-depth analysis detailing your home's value as well as a comparison with similar homes in the area
Home Values in the Area
Average Home Value in this Area
Purchase History
| Date | Buyer | Sale Price | Title Company |
|---|---|---|---|
| Tong Fang Cai | $572,000 | None Available | |
| Gelt Venture Llc | $382,500 | Title Crafters | |
| Koch Madeline M | -- | -- |
Source: Public Records
Mortgage History
| Date | Status | Borrower | Loan Amount |
|---|---|---|---|
| Closed | Tong Fang Cai | $150,000 | |
| Previous Owner | Gelt Venture Llc | $282,500 |
Source: Public Records
Tax History Compared to Growth
Tax History
| Year | Tax Paid | Tax Assessment Tax Assessment Total Assessment is a certain percentage of the fair market value that is determined by local assessors to be the total taxable value of land and additions on the property. | Land | Improvement |
|---|---|---|---|---|
| 2025 | $6,959 | $46,380 | $6,936 | $39,444 |
| 2024 | $6,959 | $49,500 | $6,131 | $43,369 |
| 2023 | $7,036 | $34,646 | $6,214 | $28,432 |
| 2022 | $6,864 | $43,140 | $8,760 | $34,380 |
| 2021 | $6,827 | $38,460 | $8,760 | $29,700 |
| 2020 | $6,478 | $39,540 | $8,760 | $30,780 |
| 2019 | $6,040 | $38,160 | $8,760 | $29,400 |
| 2018 | $5,886 | $28,872 | $7,331 | $21,541 |
| 2017 | $5,841 | $28,654 | $7,923 | $20,731 |
| 2016 | $5,404 | $27,033 | $7,925 | $19,108 |
| 2015 | $4,617 | $25,503 | $7,219 | $18,284 |
| 2014 | $4,617 | $24,060 | $7,320 | $16,740 |
Source: Public Records
Map
Nearby Homes
- 98 N Railroad Ave
- 84 Sheridan Ave
- 4 Sheridan Ave
- 23 Marie St
- 25 Marie St
- 31 Alan Loop Unit 65
- 164 Stonegate Dr
- 63 Gateway Dr Unit 172
- 80 Hillcrest Terrace
- 72 Alan Loop
- 69 Fayette Ave
- 39 Winfield Ave
- 89 Columbus Ave
- 1890 Clove Rd
- 1 Neckar Ave
- 190A Pierce St
- 190 Pierce St Unit A
- 112 Windermere Rd
- 215 Pierce St
- 448 Neckar Ave
- 36 Grasmere Ave
- 32 Grasmere Ave
- 38 Grasmere Ave
- 40 Grasmere Ave
- 42 Grasmere Ave
- 22 Grasmere Ave Unit 1
- 22 Grasmere Ave
- 50 Garretson Ln
- 52 Garretson Ln
- 54 Garretson Ln
- 50 N Railroad Ave
- 18 Grasmere Ave
- 56 Garretson Ln
- 41 Grasmere Ave
- 54 N Railroad Ave
- 50 Grasmere Dr
- 39 Grasmere Ave
- 58 Garretson Ln
- 29 Grasmere Ave
- 37 Grasmere Ave