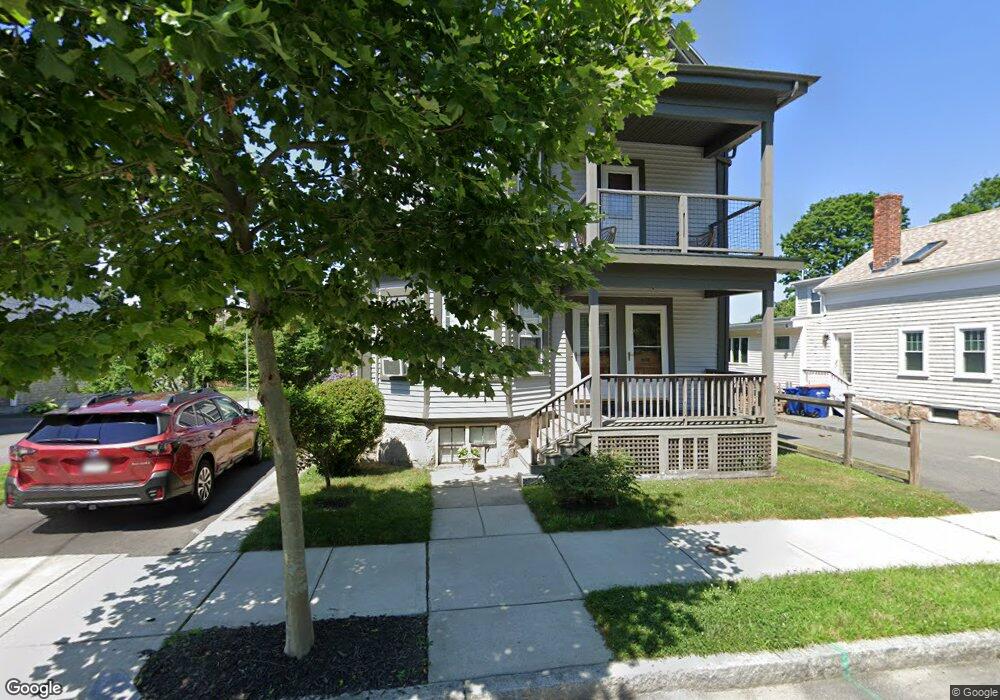
34 Green St Unit 36 Fairhaven, MA 02719
Estimated Value: $471,000 - $596,945
4
Beds
2
Baths
2,576
Sq Ft
$204/Sq Ft
Est. Value
About This Home
This home is located at 34 Green St Unit 36, Fairhaven, MA 02719 and is currently estimated at $526,236, approximately $204 per square foot. 34 Green St Unit 36 is a home located in Bristol County with nearby schools including Fairhaven High School, City On A Hill Charter Public School New Bedford, and St. Joseph School.
Ownership History
Date
Name
Owned For
Owner Type
Purchase Details
Closed on
Jan 21, 2026
Sold by
Hurley Homes Llc
Bought by
Hurley Jermaine A
Current Estimated Value
Purchase Details
Closed on
Nov 27, 2002
Sold by
Pepin Barbara F
Bought by
Pepin Mathew A and Morse Melissa A
Home Financials for this Owner
Home Financials are based on the most recent Mortgage that was taken out on this home.
Original Mortgage
$175,000
Interest Rate
6.16%
Mortgage Type
Purchase Money Mortgage
Create a Home Valuation Report for This Property
The Home Valuation Report is an in-depth analysis detailing your home's value as well as a comparison with similar homes in the area
Home Values in the Area
Average Home Value in this Area
Purchase History
| Date | Buyer | Sale Price | Title Company |
|---|---|---|---|
| Hurley Jermaine A | -- | -- | |
| Pepin Mathew A | $175,000 | -- |
Source: Public Records
Mortgage History
| Date | Status | Borrower | Loan Amount |
|---|---|---|---|
| Previous Owner | Pepin Mathew A | $30,000 | |
| Previous Owner | Pepin Mathew A | $175,000 |
Source: Public Records
Tax History
| Year | Tax Paid | Tax Assessment Tax Assessment Total Assessment is a certain percentage of the fair market value that is determined by local assessors to be the total taxable value of land and additions on the property. | Land | Improvement |
|---|---|---|---|---|
| 2025 | $43 | $466,500 | $242,600 | $223,900 |
| 2024 | $4,237 | $459,000 | $242,600 | $216,400 |
| 2023 | $4,083 | $410,400 | $209,300 | $201,100 |
| 2022 | $3,869 | $378,600 | $190,600 | $188,000 |
| 2021 | $3,808 | $337,300 | $173,300 | $164,000 |
| 2020 | $3,731 | $337,300 | $173,300 | $164,000 |
| 2019 | $3,710 | $317,900 | $148,500 | $169,400 |
| 2018 | $3,478 | $300,700 | $141,300 | $159,400 |
| 2017 | $3,398 | $282,200 | $136,000 | $146,200 |
| 2016 | $3,253 | $267,100 | $133,300 | $133,800 |
| 2015 | $3,206 | $263,900 | $133,300 | $130,600 |
Source: Public Records
Map
Nearby Homes
Your Personal Tour Guide
Ask me questions while you tour the home.