34 Hefner Trace Ellijay, GA 30536
Estimated Value: $455,000 - $541,000
2
Beds
2
Baths
2,656
Sq Ft
$188/Sq Ft
Est. Value
About This Home
This home is located at 34 Hefner Trace, Ellijay, GA 30536 and is currently estimated at $499,217, approximately $187 per square foot. 34 Hefner Trace is a home located in Gilmer County with nearby schools including Ellijay Elementary School, Clear Creek Elementary School, and Gilmer Middle School.
Ownership History
Date
Name
Owned For
Owner Type
Purchase Details
Closed on
May 14, 2010
Sold by
The Bank Of New York Mellon
Bought by
Cunningham John Allen
Current Estimated Value
Purchase Details
Closed on
Nov 4, 2009
Sold by
Cross Gary and Cross Heather
Bought by
Certificateholders Cwabs Inc
Purchase Details
Closed on
Nov 24, 2003
Sold by
Brown Glen
Bought by
Cross Gary and Cross Heather
Purchase Details
Closed on
Sep 22, 2000
Sold by
Johnson M P
Bought by
Brown Glen
Purchase Details
Closed on
Aug 31, 2000
Sold by
Huff Roger D
Bought by
Johnson M P
Purchase Details
Closed on
Jun 1, 1974
Sold by
Huff Roger D
Bought by
Huff Roger D
Purchase Details
Closed on
May 1, 1973
Bought by
Huff Roger D
Create a Home Valuation Report for This Property
The Home Valuation Report is an in-depth analysis detailing your home's value as well as a comparison with similar homes in the area
Home Values in the Area
Average Home Value in this Area
Purchase History
| Date | Buyer | Sale Price | Title Company |
|---|---|---|---|
| Cunningham John Allen | $43,900 | -- | |
| Certificateholders Cwabs Inc | $109,800 | -- | |
| The Bank Of New York Mellon | -- | -- | |
| Cross Gary | $99,000 | -- | |
| Brown Glen | $30,000 | -- | |
| Johnson M P | $20,000 | -- | |
| Huff Roger D | -- | -- | |
| Huff Roger D | -- | -- |
Source: Public Records
Tax History Compared to Growth
Tax History
| Year | Tax Paid | Tax Assessment Tax Assessment Total Assessment is a certain percentage of the fair market value that is determined by local assessors to be the total taxable value of land and additions on the property. | Land | Improvement |
|---|---|---|---|---|
| 2025 | $575 | $228,600 | $8,000 | $220,600 |
| 2024 | $575 | $197,640 | $7,200 | $190,440 |
| 2023 | $592 | $205,840 | $7,200 | $198,640 |
| 2022 | $616 | $164,280 | $6,000 | $158,280 |
| 2021 | $684 | $128,120 | $6,000 | $122,120 |
| 2020 | $761 | $106,200 | $6,000 | $100,200 |
| 2019 | $763 | $94,880 | $3,600 | $91,280 |
| 2018 | $322 | $94,880 | $3,600 | $91,280 |
| 2017 | $290 | $41,720 | $4,480 | $37,240 |
| 2016 | $290 | $37,320 | $3,720 | $33,600 |
| 2015 | $272 | $35,640 | $5,200 | $30,440 |
| 2014 | $913 | $35,640 | $5,200 | $30,440 |
| 2013 | -- | $35,640 | $5,200 | $30,440 |
Source: Public Records
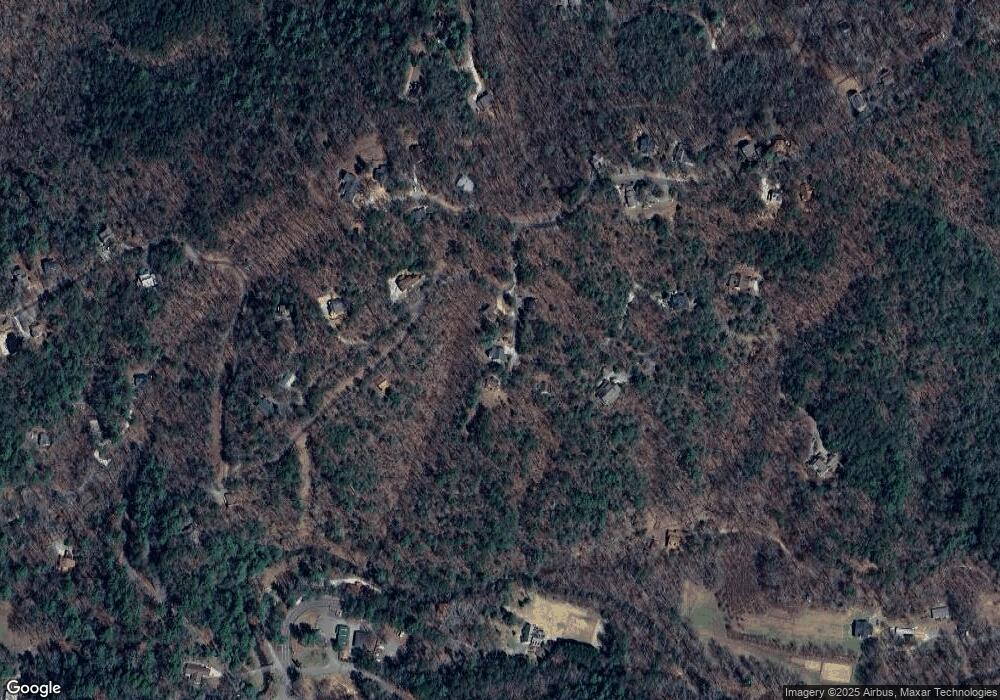
Map
Nearby Homes
- Lot A28 Laurel Ridge Dr
- 60 Laurel Ridge Ct Unit A 12
- 60 Laurel Ridge Ct
- 120 Dogwood Terrace Unit 4256
- 705 Laurel Ridge Dr Unit B54
- 705 Laurel Ridge Dr
- 330 Skyview Dr
- 330 Skyview Dr Unit M-10
- 96 Clubhouse Ct
- 0 Skyview Dr Unit 1017026
- 0 Skyview Dr Unit 10296170
- 60 Clubhouse Ct
- 125 Waters Rd
- 0 Pine Ridge Rd Unit 418823
- LOT P1 Goldmine Dr
- LOT J251 Pine Ridge Ct
- 0.55 ACRES Pine Ridge Rd
- 0.55 AC Pine Ridge Rd
- 0.55 A Pine Ridge Rd
- Lot J260 Pine Ridge Rd
- 0 Laurel Ridge Dr Unit 414850
- 0 Laurel Ridge Dr Unit 7320567
- 0 Laurel Ridge Dr Unit 7196364
- 0 Laurel Ridge Dr Unit 317054
- 0 Laurel Ridge Dr Unit 304592
- 54 Hefner Trace
- 416 Laurel Ridge Dr
- TBD Laurel Ridge Dr
- A-35 Laurel Ridge Dr
- A 34 Laurel Ridge Dr
- 49 Hefner Trace
- 5 Hefner Trace
- A-47 Hefner Trace
- 306 Laurel Ridge Dr
- 0 Laurel Ridge Unit A 34 7280418
- 0 Laurel Ridge Unit 292587
- 381 Laurel Ridge Dr
- 383 Laurel Ridge Dr
- 2 LTS Laurel Ridge Ct
- 3LOTS Laurel Ridge Ct