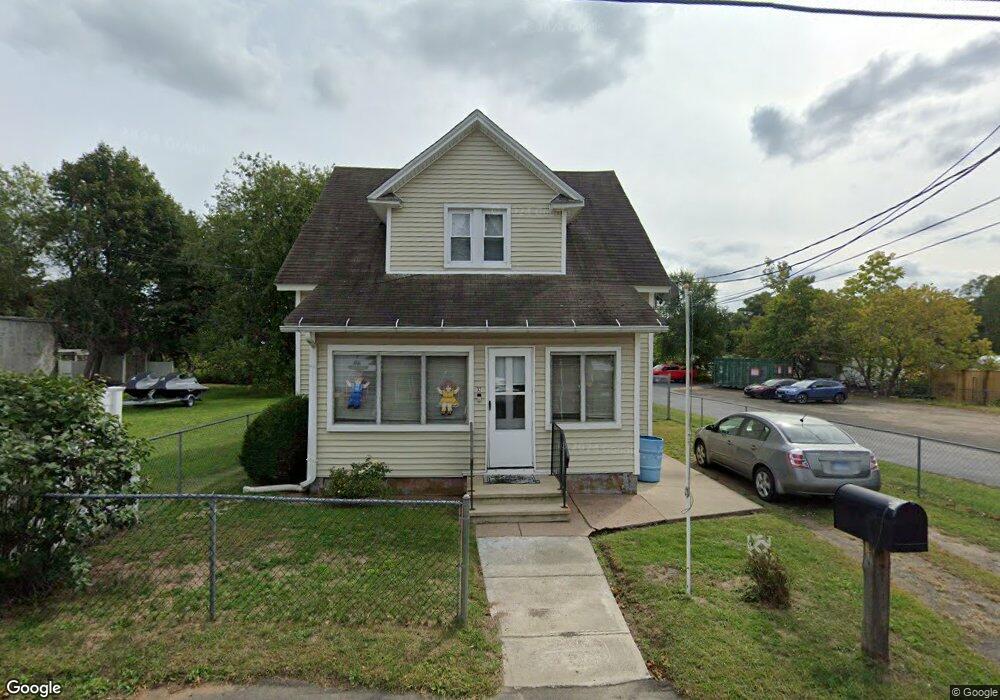
34 High St West Haven, CT 06516
Allingtown NeighborhoodEstimated Value: $598,943
--
Bed
--
Bath
4,840
Sq Ft
$124/Sq Ft
Est. Value
About This Home
This home is located at 34 High St, West Haven, CT 06516 and is currently estimated at $598,943, approximately $123 per square foot. 34 High St is a home located in New Haven County with nearby schools including Carrigan 5/6 Intermediate School, Harry M. Bailey Middle School, and West Haven High School.
Ownership History
Date
Name
Owned For
Owner Type
Purchase Details
Closed on
May 5, 2015
Sold by
Colonna Marco and Colonna Sandro
Bought by
Apec Llc
Current Estimated Value
Home Financials for this Owner
Home Financials are based on the most recent Mortgage that was taken out on this home.
Original Mortgage
$240,000
Outstanding Balance
$138,332
Interest Rate
3.76%
Mortgage Type
Commercial
Estimated Equity
$460,611
Create a Home Valuation Report for This Property
The Home Valuation Report is an in-depth analysis detailing your home's value as well as a comparison with similar homes in the area
Home Values in the Area
Average Home Value in this Area
Purchase History
| Date | Buyer | Sale Price | Title Company |
|---|---|---|---|
| Apec Llc | $300,000 | -- | |
| Apec Llc | $300,000 | -- |
Source: Public Records
Mortgage History
| Date | Status | Borrower | Loan Amount |
|---|---|---|---|
| Open | Apec Llc | $240,000 | |
| Closed | Apec Llc | $240,000 | |
| Previous Owner | Apec Llc | $200,000 |
Source: Public Records
Tax History Compared to Growth
Tax History
| Year | Tax Paid | Tax Assessment Tax Assessment Total Assessment is a certain percentage of the fair market value that is determined by local assessors to be the total taxable value of land and additions on the property. | Land | Improvement |
|---|---|---|---|---|
| 2025 | $11,080 | $325,780 | $86,310 | $239,470 |
| 2024 | $13,128 | $274,120 | $77,840 | $196,280 |
| 2023 | $12,725 | $274,120 | $77,840 | $196,280 |
| 2022 | $12,503 | $274,120 | $77,840 | $196,280 |
| 2021 | $12,505 | $274,120 | $77,840 | $196,280 |
| 2020 | $13,904 | $269,990 | $69,160 | $200,830 |
| 2019 | $13,688 | $269,990 | $69,160 | $200,830 |
| 2018 | $13,316 | $269,990 | $69,160 | $200,830 |
| 2017 | $9,520 | $269,990 | $69,160 | $200,830 |
| 2016 | $7,318 | $207,550 | $69,160 | $138,390 |
| 2015 | $4,913 | $157,220 | $64,820 | $92,400 |
| 2014 | -- | $157,220 | $64,820 | $92,400 |
Source: Public Records
Map
Nearby Homes
- 14 Homestead Ave
- 43 Clifton St
- 1014 Campbell Ave Unit 14
- 22 Thill St
- 194 Ella T Grasso Blvd
- 941 Campbell Ave
- 22 Bristol St
- 104 Terrace Ave
- 38 Chauncey St
- 103 Gilbert St
- 60 Andrews St
- 25 Richards St
- 65 Westfield St
- 29 Abner St
- 81 Homeside Ave
- 35 Terrace Ave
- 29 Birch St
- 467 Columbus Ave
- 312 Davenport Ave
- 170 Wood St