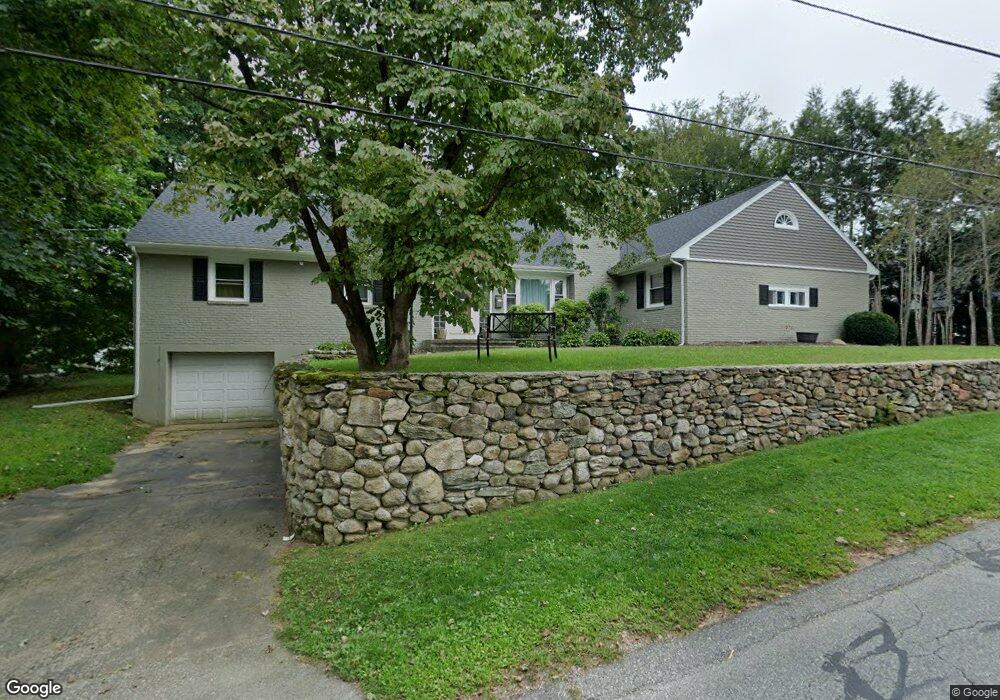
34 Hillview Ave North Smithfield, RI 02896
Estimated Value: $496,000 - $557,000
3
Beds
3
Baths
2,800
Sq Ft
$183/Sq Ft
Est. Value
About This Home
This home is located at 34 Hillview Ave, North Smithfield, RI 02896 and is currently estimated at $512,180, approximately $182 per square foot. 34 Hillview Ave is a home located in Providence County with nearby schools including North Smithfield Elementary School, North Smithfield Middle School, and North Smithfield High School.
Ownership History
Date
Name
Owned For
Owner Type
Purchase Details
Closed on
Mar 14, 2011
Sold by
Brouillard Louis and Brouillard Lisa
Bought by
Sweeney Michael P
Current Estimated Value
Home Financials for this Owner
Home Financials are based on the most recent Mortgage that was taken out on this home.
Original Mortgage
$263,155
Interest Rate
4.83%
Mortgage Type
Purchase Money Mortgage
Purchase Details
Closed on
Feb 6, 2004
Sold by
King Sandra C
Bought by
King Serenity J
Create a Home Valuation Report for This Property
The Home Valuation Report is an in-depth analysis detailing your home's value as well as a comparison with similar homes in the area
Home Values in the Area
Average Home Value in this Area
Purchase History
| Date | Buyer | Sale Price | Title Company |
|---|---|---|---|
| Sweeney Michael P | $270,000 | -- | |
| King Serenity J | $256,000 | -- |
Source: Public Records
Mortgage History
| Date | Status | Borrower | Loan Amount |
|---|---|---|---|
| Open | Toscano Armand J | $229,000 | |
| Closed | Toscano Armand J | $263,155 |
Source: Public Records
Tax History Compared to Growth
Tax History
| Year | Tax Paid | Tax Assessment Tax Assessment Total Assessment is a certain percentage of the fair market value that is determined by local assessors to be the total taxable value of land and additions on the property. | Land | Improvement |
|---|---|---|---|---|
| 2024 | $5,236 | $354,500 | $82,900 | $271,600 |
| 2023 | $5,052 | $354,500 | $82,900 | $271,600 |
| 2022 | $4,931 | $354,500 | $82,900 | $271,600 |
| 2021 | $4,607 | $282,800 | $79,600 | $203,200 |
| 2020 | $4,607 | $282,800 | $79,600 | $203,200 |
| 2019 | $4,956 | $312,300 | $79,600 | $232,700 |
| 2018 | $4,096 | $237,600 | $56,200 | $181,400 |
| 2017 | $3,996 | $237,600 | $56,200 | $181,400 |
| 2016 | $3,887 | $237,600 | $56,200 | $181,400 |
| 2015 | $3,801 | $227,900 | $56,200 | $171,700 |
| 2014 | $3,651 | $227,900 | $56,200 | $171,700 |
Source: Public Records
Map
Nearby Homes