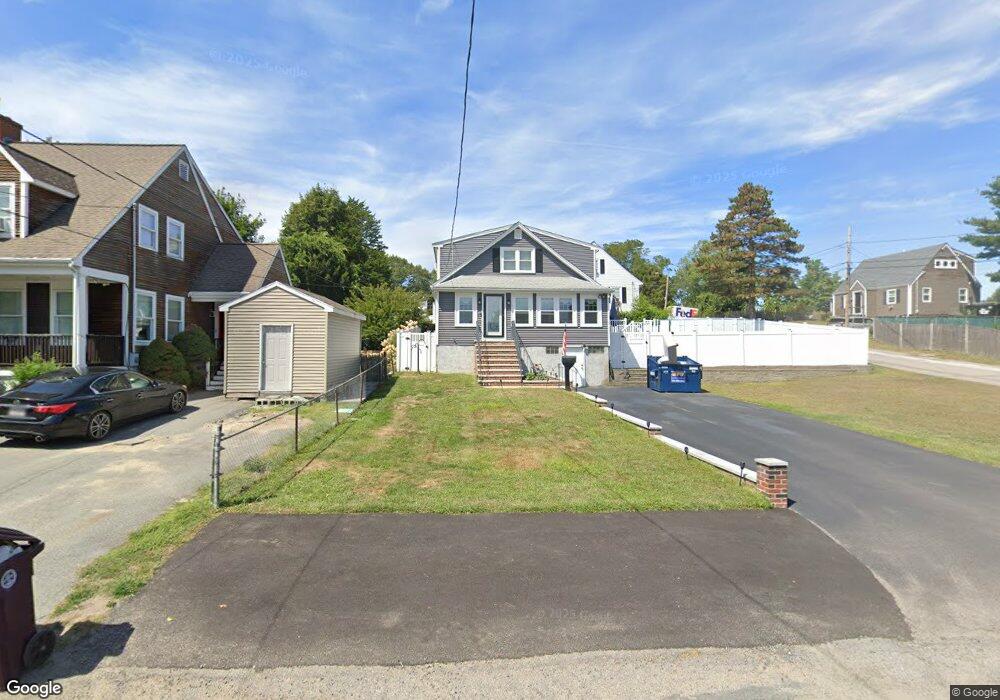
34 Hinston Rd East Weymouth, MA 02189
East Weymouth NeighborhoodEstimated Value: $531,000 - $650,000
3
Beds
2
Baths
1,456
Sq Ft
$406/Sq Ft
Est. Value
About This Home
This home is located at 34 Hinston Rd, East Weymouth, MA 02189 and is currently estimated at $590,955, approximately $405 per square foot. 34 Hinston Rd is a home located in Norfolk County with nearby schools including Abigail Adams Middle School, Wessagusset Elementary School, and Weymouth Middle School Chapman.
Ownership History
Date
Name
Owned For
Owner Type
Purchase Details
Closed on
Dec 4, 2006
Sold by
Mccaffrey John
Bought by
Dellamano Daniel and Dellamano Dina
Current Estimated Value
Home Financials for this Owner
Home Financials are based on the most recent Mortgage that was taken out on this home.
Original Mortgage
$318,155
Outstanding Balance
$190,745
Interest Rate
6.36%
Mortgage Type
Purchase Money Mortgage
Estimated Equity
$400,210
Purchase Details
Closed on
Jun 30, 2006
Sold by
Perry Henry L
Bought by
Mccaffrey John
Create a Home Valuation Report for This Property
The Home Valuation Report is an in-depth analysis detailing your home's value as well as a comparison with similar homes in the area
Home Values in the Area
Average Home Value in this Area
Purchase History
| Date | Buyer | Sale Price | Title Company |
|---|---|---|---|
| Dellamano Daniel | $334,900 | -- | |
| Mccaffrey John | $180,000 | -- |
Source: Public Records
Mortgage History
| Date | Status | Borrower | Loan Amount |
|---|---|---|---|
| Open | Dellamano Daniel | $318,155 |
Source: Public Records
Tax History Compared to Growth
Tax History
| Year | Tax Paid | Tax Assessment Tax Assessment Total Assessment is a certain percentage of the fair market value that is determined by local assessors to be the total taxable value of land and additions on the property. | Land | Improvement |
|---|---|---|---|---|
| 2025 | $4,774 | $472,700 | $185,800 | $286,900 |
| 2024 | $4,625 | $450,300 | $177,000 | $273,300 |
| 2023 | $4,358 | $417,000 | $163,900 | $253,100 |
| 2022 | $4,574 | $399,100 | $151,800 | $247,300 |
| 2021 | $4,170 | $355,200 | $151,800 | $203,400 |
| 2020 | $3,850 | $323,000 | $144,200 | $178,800 |
| 2019 | $3,666 | $302,500 | $131,300 | $171,200 |
| 2018 | $3,548 | $283,800 | $125,100 | $158,700 |
| 2017 | $3,383 | $264,100 | $119,100 | $145,000 |
| 2016 | $3,058 | $238,900 | $114,500 | $124,400 |
| 2015 | $2,886 | $223,700 | $114,500 | $109,200 |
| 2014 | $2,921 | $219,600 | $118,400 | $101,200 |
Source: Public Records
Map
Nearby Homes
- 2 Winstead Rd
- 43 Flint Locke Dr
- 30 Puritan Rd
- 320 Green St
- 425 East St
- 59 Katherine St
- 20 Richards Rd
- 669 Commercial St
- 109 Merryknoll Rd
- 56 Putnam St
- 65 Saning Rd
- 88 Saning Rd
- 145 Jaffrey St
- 575 Broad St Unit 305
- 575 Broad St Unit 215
- 7 Stevens Way
- 14 Crescent Rd
- 70 Biscayne Ave
- 367 Essex St
- 38 Idlewell St