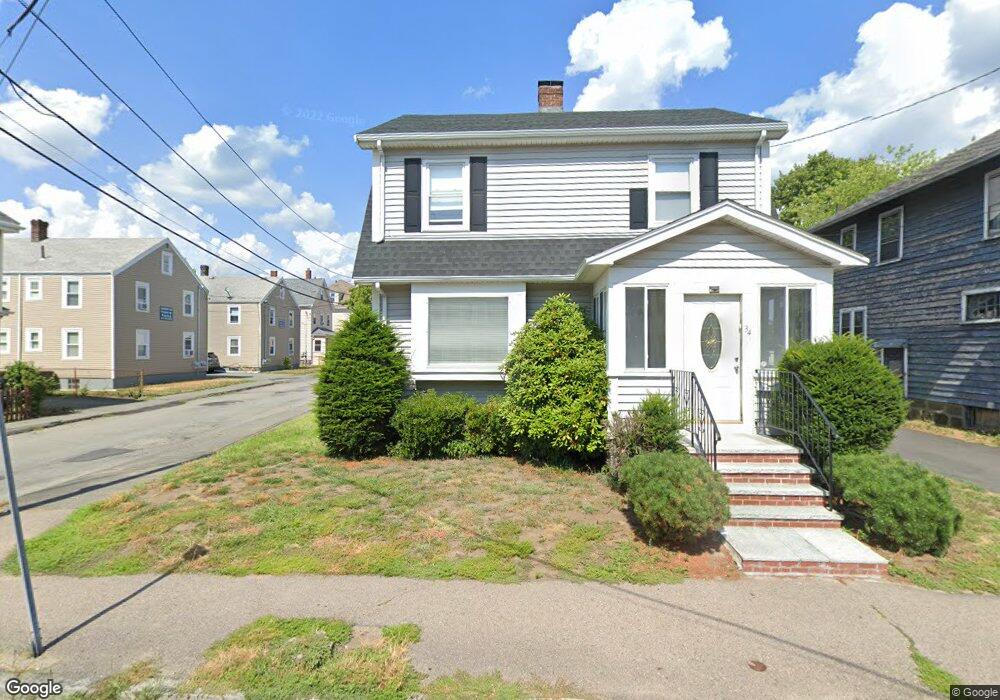
34 Holmes St Unit 1 Quincy, MA 02171
Montclair NeighborhoodEstimated Value: $711,377 - $750,000
3
Beds
2
Baths
1,248
Sq Ft
$586/Sq Ft
Est. Value
About This Home
This home is located at 34 Holmes St Unit 1, Quincy, MA 02171 and is currently estimated at $731,344, approximately $586 per square foot. 34 Holmes St Unit 1 is a home located in Norfolk County with nearby schools including Montclair Elementary School, Atlantic Middle School, and North Quincy High School.
Ownership History
Date
Name
Owned For
Owner Type
Purchase Details
Closed on
Mar 17, 2024
Sold by
Mo Xiu F
Bought by
Mo Alice and Yip Karen
Current Estimated Value
Purchase Details
Closed on
Oct 30, 2003
Sold by
Hoffman Claire A
Bought by
Lau Vinny and Hong My
Home Financials for this Owner
Home Financials are based on the most recent Mortgage that was taken out on this home.
Original Mortgage
$313,500
Interest Rate
6.05%
Mortgage Type
Purchase Money Mortgage
Create a Home Valuation Report for This Property
The Home Valuation Report is an in-depth analysis detailing your home's value as well as a comparison with similar homes in the area
Home Values in the Area
Average Home Value in this Area
Purchase History
| Date | Buyer | Sale Price | Title Company |
|---|---|---|---|
| Mo Alice | -- | None Available | |
| Lau Vinny | $330,000 | -- |
Source: Public Records
Mortgage History
| Date | Status | Borrower | Loan Amount |
|---|---|---|---|
| Previous Owner | Lau Vinny | $313,500 |
Source: Public Records
Tax History Compared to Growth
Tax History
| Year | Tax Paid | Tax Assessment Tax Assessment Total Assessment is a certain percentage of the fair market value that is determined by local assessors to be the total taxable value of land and additions on the property. | Land | Improvement |
|---|---|---|---|---|
| 2025 | $7,337 | $636,300 | $331,400 | $304,900 |
| 2024 | $6,972 | $618,600 | $331,400 | $287,200 |
| 2023 | $6,502 | $584,200 | $315,700 | $268,500 |
| 2022 | $6,244 | $521,200 | $274,500 | $246,700 |
| 2021 | $5,981 | $492,700 | $261,400 | $231,300 |
| 2020 | $5,847 | $470,400 | $261,400 | $209,000 |
| 2019 | $5,575 | $444,200 | $244,300 | $199,900 |
| 2018 | $5,496 | $412,000 | $226,300 | $185,700 |
| 2017 | $5,400 | $381,100 | $215,400 | $165,700 |
| 2016 | $4,936 | $343,700 | $187,300 | $156,400 |
| 2015 | $4,592 | $314,500 | $170,300 | $144,200 |
| 2014 | $4,507 | $303,300 | $162,200 | $141,100 |
Source: Public Records
Map
Nearby Homes
- 17 Holmes St Unit 2
- 17 Holmes St Unit 4
- 115 W Squantum St Unit 907
- 115 W Squantum St Unit 810
- 85 E Squantum St Unit 10
- 143 Arlington St
- 250 Fayette St
- 11 Earle St
- 58 Bayfield Rd S
- 101 Beach St
- 91 Atlantic St
- 201 Billings St
- 68 Atlantic St
- 133 Commander Shea Blvd Unit 315
- 133 Commander Shea Blvd Unit 609
- 133 Commander Shea Blvd Unit 620
- 133 Commander Shea Blvd Unit 204
- 60 Newbury St Unit 10
- 297 Billings St
- 90 Shore Ave
- 34 Holmes St
- 34 Holmes St
- 38 Holmes St
- 28 Holmes St
- 42 Holmes St
- 17 Moscow St Unit 1L
- 17 Moscow St
- 24 Holmes St
- 33 Holmes St Unit 1
- 33 Holmes St Unit 4
- 33 Holmes St
- 33 Holmes St Unit 3
- 33 Holmes St Unit 2
- 13 Moscow St
- 13 Moscow St Unit 1R
- 13 Moscow St Unit 1
- 13 Moscow St
- 13 Moscow St Unit 2R
- 13 Moscow St Unit 2/F
- 10 Moscow St