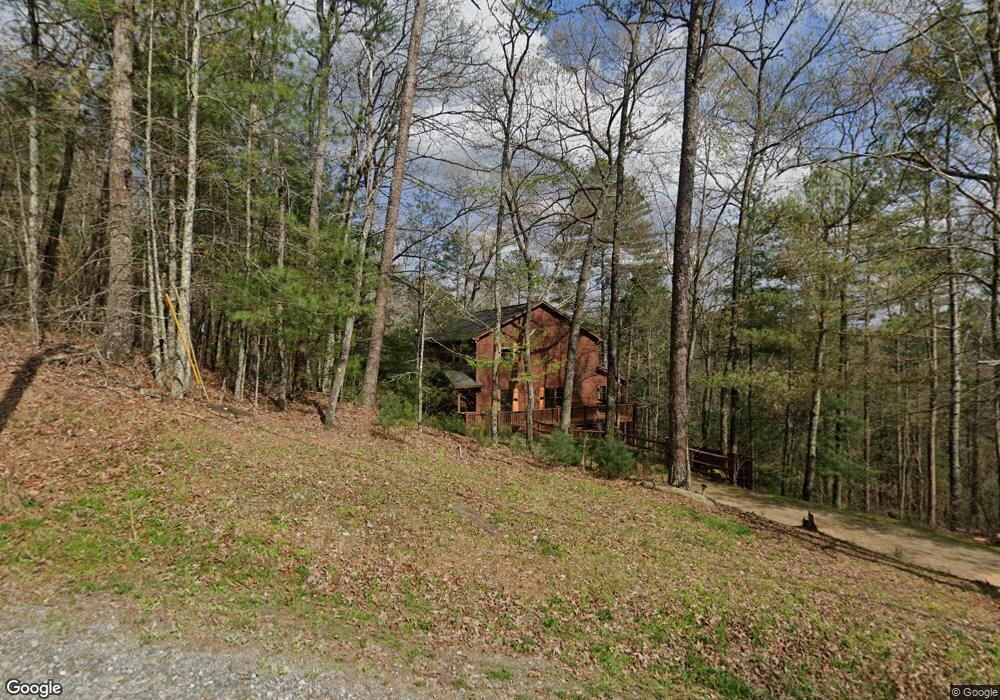
34 Indian Ln Unit 3743 Ellijay, GA 30540
Estimated Value: $496,000 - $583,000
3
Beds
3
Baths
1,752
Sq Ft
$313/Sq Ft
Est. Value
About This Home
This home is located at 34 Indian Ln Unit 3743, Ellijay, GA 30540 and is currently estimated at $548,126, approximately $312 per square foot. 34 Indian Ln Unit 3743 is a home located in Gilmer County with nearby schools including Mountain View Elementary School, Clear Creek Middle School, and Gilmer High School.
Ownership History
Date
Name
Owned For
Owner Type
Purchase Details
Closed on
Jul 29, 2011
Sold by
Alsobrook Tony and Alsobrook Sherry
Bought by
Lovell Kimberly D
Current Estimated Value
Home Financials for this Owner
Home Financials are based on the most recent Mortgage that was taken out on this home.
Original Mortgage
$174,915
Outstanding Balance
$120,883
Interest Rate
4.53%
Mortgage Type
New Conventional
Estimated Equity
$427,243
Purchase Details
Closed on
Mar 11, 2009
Sold by
Schwarz Penny F
Bought by
Schwarz Penny F
Purchase Details
Closed on
Jan 29, 2008
Sold by
Schwarz Penny F and Schwarz Dale R
Bought by
Schwarz Penny F
Purchase Details
Closed on
May 28, 2004
Sold by
Woodland Mortgage Co
Bought by
Irdm Enterprises Inc
Purchase Details
Closed on
Sep 29, 1998
Sold by
Woodland Trading Co
Bought by
Woodland Mortgage Co
Purchase Details
Closed on
Sep 1, 1998
Sold by
Woodland Mortgage Co
Bought by
Grantham Kim E
Purchase Details
Closed on
May 1, 1989
Bought by
Grantham Kim E
Create a Home Valuation Report for This Property
The Home Valuation Report is an in-depth analysis detailing your home's value as well as a comparison with similar homes in the area
Home Values in the Area
Average Home Value in this Area
Purchase History
| Date | Buyer | Sale Price | Title Company |
|---|---|---|---|
| Lovell Kimberly D | $169,000 | -- | |
| Schwarz Penny F | $179,400 | -- | |
| Schwarz Penny F | $229,900 | -- | |
| Irdm Enterprises Inc | $5,000 | -- | |
| Woodland Mortgage Co | -- | -- | |
| Woodland Trading Co | -- | -- | |
| Grantham Kim E | $5,500 | -- | |
| Grantham Kim E | -- | -- |
Source: Public Records
Mortgage History
| Date | Status | Borrower | Loan Amount |
|---|---|---|---|
| Open | Lovell Kimberly D | $174,915 |
Source: Public Records
Tax History Compared to Growth
Tax History
| Year | Tax Paid | Tax Assessment Tax Assessment Total Assessment is a certain percentage of the fair market value that is determined by local assessors to be the total taxable value of land and additions on the property. | Land | Improvement |
|---|---|---|---|---|
| 2024 | $3,166 | $204,320 | $8,840 | $195,480 |
| 2023 | $2,893 | $180,880 | $7,560 | $173,320 |
| 2022 | $2,654 | $150,800 | $2,000 | $148,800 |
| 2021 | $2,378 | $119,800 | $2,000 | $117,800 |
| 2020 | $2,221 | $100,960 | $1,920 | $99,040 |
| 2019 | $1,495 | $100,720 | $1,680 | $99,040 |
| 2018 | $2,213 | $96,480 | $1,680 | $94,800 |
| 2017 | $2,032 | $82,600 | $2,000 | $80,600 |
| 2016 | $2,097 | $83,520 | $2,000 | $81,520 |
| 2015 | $1,777 | $72,080 | $1,800 | $70,280 |
| 2014 | $1,670 | $65,160 | $1,800 | $63,360 |
| 2013 | -- | $67,760 | $1,800 | $65,960 |
Source: Public Records
Map
Nearby Homes
- 166 Clark Dr
- 0 Graham Ct Unit 402061
- 1800 Hicks Ford Rd
- 1800 Hicks Ford Rd Unit 8
- 142 Mountain Trace
- 1102 Hicks Ford Rd
- 1095 Fir Ln
- 928 Fir Ln Unit 3624
- 928 Fir Ln
- 1061 Fir Ln
- 60 Hickory Ln
- 55 Monitor Dr
- 940 Fir Ln Unit 3588, 3589
- 940 Fir Ln
- LT 3468 EAGLE M Fir Ln
- 3468 Fir Ln
- 326 Ponderosa Rd
- 230 Grove Ln Unit 3642
- 230 Grove Ln
- 334 Ponderosa Rd
- 34 Indian Ln
- LOTS 3790 3791 Indian Ln
- L3745 Falcon Dr
- L3721 Clark Trail
- 0 Clark Trail Unit 8428438
- 0 Clark Trail
- 280 Clark Dr Unit 3718
- 280 Clark Dr
- 306 Clark Trail
- 260 Clark Trail
- 260 Clark Dr
- 332 Clark Trail
- 280 Clark Trail
- 3763 Graham Ct
- 40 Graham Ct Unit 3713
- 40 Graham Ct
- 356 Clark Trail
- LT 3711 Graham Ct
- L3715 Falcon Dr
- 0 Indian Ln Unit 1371213