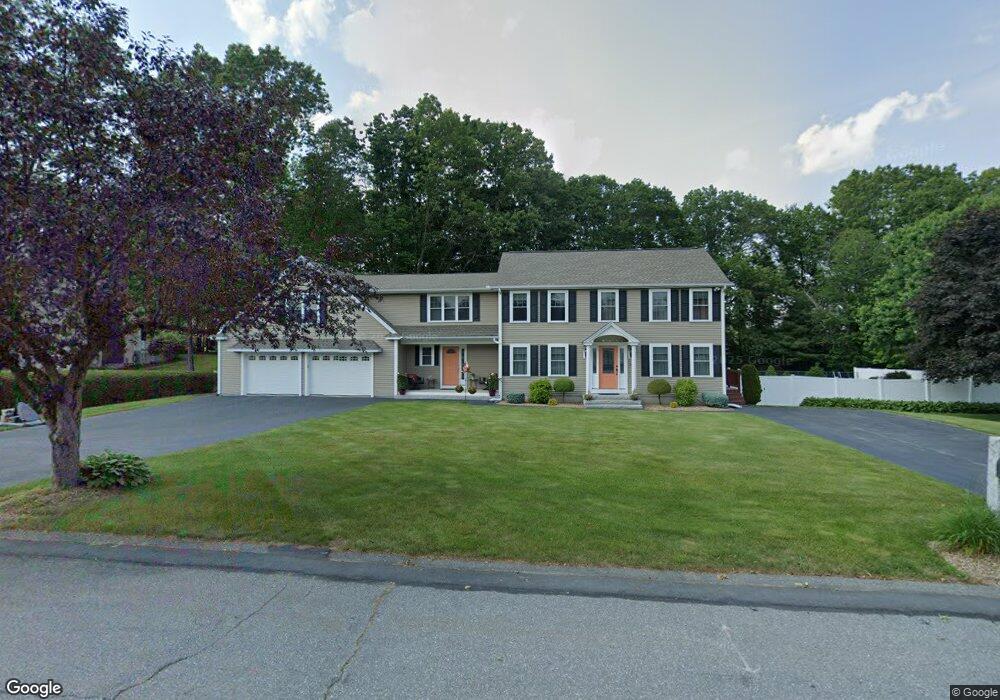
34 Jefferson Rd Dracut, MA 01826
Estimated Value: $827,000 - $945,000
5
Beds
4
Baths
3,626
Sq Ft
$246/Sq Ft
Est. Value
About This Home
This home is located at 34 Jefferson Rd, Dracut, MA 01826 and is currently estimated at $890,693, approximately $245 per square foot. 34 Jefferson Rd is a home located in Middlesex County with nearby schools including George H. Englesby Elementary School, Richardson Middle School, and Dracut Senior High School.
Ownership History
Date
Name
Owned For
Owner Type
Purchase Details
Closed on
Dec 30, 2013
Sold by
Lacount Dennis P and Lacount Janice T
Bought by
Lacount Harry P and Lacount Mary L
Current Estimated Value
Purchase Details
Closed on
Aug 28, 1992
Sold by
Premier Homes Inc
Bought by
Lacount Dennis P and Lacount Janice
Create a Home Valuation Report for This Property
The Home Valuation Report is an in-depth analysis detailing your home's value as well as a comparison with similar homes in the area
Home Values in the Area
Average Home Value in this Area
Purchase History
We collect this data history from publicly available records. To have your information removed, we recommend requesting removal directly through your county’s website.
| Date | Buyer | Sale Price | Title Company |
|---|---|---|---|
| Lacount Harry P | -- | -- | |
| Lacount Dennis P | $153,900 | -- |
Source: Public Records
Mortgage History
We collect this data history from publicly available records. To have your information removed, we recommend requesting removal directly through your county’s website.
| Date | Status | Borrower | Loan Amount |
|---|---|---|---|
| Previous Owner | Lacount Dennis P | $150,000 | |
| Previous Owner | Lacount Dennis P | $145,000 | |
| Previous Owner | Lacount Dennis P | $14,000 |
Source: Public Records
Tax History
| Year | Tax Paid | Tax Assessment Tax Assessment Total Assessment is a certain percentage of the fair market value that is determined by local assessors to be the total taxable value of land and additions on the property. | Land | Improvement |
|---|---|---|---|---|
| 2025 | $8,225 | $812,700 | $251,700 | $561,000 |
| 2024 | $7,874 | $753,500 | $239,800 | $513,700 |
| 2023 | $7,639 | $659,700 | $208,600 | $451,100 |
| 2022 | $7,590 | $617,600 | $189,700 | $427,900 |
| 2021 | $6,161 | $563,400 | $172,300 | $391,100 |
| 2020 | $7,250 | $543,100 | $167,100 | $376,000 |
| 2019 | $5,719 | $506,200 | $159,100 | $347,100 |
| 2018 | $5,945 | $491,400 | $159,100 | $332,300 |
| 2017 | $6,867 | $491,400 | $159,100 | $332,300 |
| 2016 | $6,776 | $456,600 | $159,900 | $296,700 |
| 2015 | $6,648 | $445,300 | $159,900 | $285,400 |
| 2014 | $6,186 | $426,900 | $159,900 | $267,000 |
Source: Public Records
Map
Nearby Homes
- 14 Dale Ave
- 10 Vandette Ave
- 36 Fanning Ave
- 1310 Mammoth Rd
- 1905 Lakeview Ave
- 45 Christy Ave
- 51 Richardson Ave
- 43 & 53 5th St
- 53 Vinal St
- 4 Wilshire Ln Unit 4
- 6 Wilshire Ln Unit 6
- 339 Passaconaway Dr
- 13 Dallas Dr Unit 305
- 13 Dallas Dr Unit 107
- 54 Long Dr
- 190 Wyndridge Cir
- 84 Tennis Plaza Rd Unit 33
- 16 Berkeley St
- 651 Nashua Rd
- 136 Wyndridge Cir
Your Personal Tour Guide
Ask me questions while you tour the home.