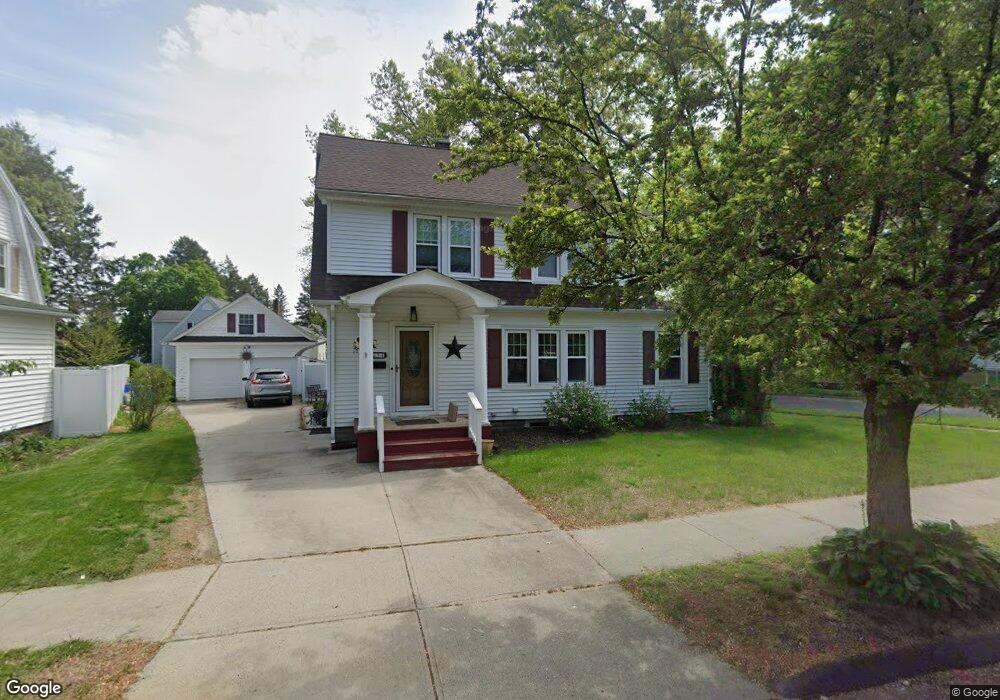
34 Johnson St West Springfield, MA 01089
Estimated Value: $345,000 - $412,000
3
Beds
2
Baths
1,724
Sq Ft
$214/Sq Ft
Est. Value
About This Home
This home is located at 34 Johnson St, West Springfield, MA 01089 and is currently estimated at $368,432, approximately $213 per square foot. 34 Johnson St is a home located in Hampden County with nearby schools including West Springfield High School and St Thomas The Apostle School.
Ownership History
Date
Name
Owned For
Owner Type
Purchase Details
Closed on
Dec 15, 2025
Sold by
Poggi Mark G and Poggi Kathleen M
Bought by
Baker Kayla M
Current Estimated Value
Purchase Details
Closed on
Dec 29, 2006
Sold by
Wilson Stephen G and Wilson Susan M
Bought by
Baker Kathleen M and Poggi Mark G
Home Financials for this Owner
Home Financials are based on the most recent Mortgage that was taken out on this home.
Original Mortgage
$230,000
Interest Rate
6.29%
Mortgage Type
Purchase Money Mortgage
Purchase Details
Closed on
Jun 16, 1993
Sold by
Mueller Cecelia J and Mueller Lawrence E
Bought by
Wilson Stephen G and Wilson Susan M
Home Financials for this Owner
Home Financials are based on the most recent Mortgage that was taken out on this home.
Original Mortgage
$109,544
Interest Rate
7.38%
Mortgage Type
Purchase Money Mortgage
Purchase Details
Closed on
Sep 10, 1987
Sold by
Mildred Jensen Est
Bought by
Mueller Howard E
Create a Home Valuation Report for This Property
The Home Valuation Report is an in-depth analysis detailing your home's value as well as a comparison with similar homes in the area
Home Values in the Area
Average Home Value in this Area
Purchase History
| Date | Buyer | Sale Price | Title Company |
|---|---|---|---|
| Baker Kayla M | -- | -- | |
| Baker Kathleen M | $234,500 | -- | |
| Wilson Stephen G | $110,000 | -- | |
| Mueller Howard E | $80,000 | -- |
Source: Public Records
Mortgage History
| Date | Status | Borrower | Loan Amount |
|---|---|---|---|
| Previous Owner | Mueller Howard E | $221,284 | |
| Previous Owner | Baker Kathleen M | $230,000 | |
| Previous Owner | Mueller Howard E | $110,000 | |
| Previous Owner | Mueller Howard E | $106,400 | |
| Previous Owner | Mueller Howard E | $109,544 |
Source: Public Records
Tax History
| Year | Tax Paid | Tax Assessment Tax Assessment Total Assessment is a certain percentage of the fair market value that is determined by local assessors to be the total taxable value of land and additions on the property. | Land | Improvement |
|---|---|---|---|---|
| 2025 | $4,415 | $296,900 | $106,600 | $190,300 |
| 2024 | $4,196 | $283,300 | $106,600 | $176,700 |
| 2023 | $4,042 | $260,100 | $106,600 | $153,500 |
| 2022 | $3,694 | $234,400 | $96,700 | $137,700 |
| 2021 | $3,466 | $205,100 | $88,500 | $116,600 |
| 2020 | $3,485 | $205,100 | $88,500 | $116,600 |
| 2019 | $3,478 | $205,100 | $88,500 | $116,600 |
| 2018 | $3,497 | $205,100 | $88,500 | $116,600 |
| 2017 | $3,497 | $205,100 | $88,500 | $116,600 |
| 2016 | $3,463 | $203,800 | $85,000 | $118,800 |
| 2015 | $3,396 | $199,900 | $83,300 | $116,600 |
| 2014 | $824 | $199,900 | $83,300 | $116,600 |
Source: Public Records
Map
Nearby Homes
- 40 Johnson St
- 24 Johnson St
- 46 Johnson St
- 103 Wilder Terrace
- 87 Wilder Terrace
- 110 Wilder Terrace
- 84 Nelson St
- 18 Johnson St
- 81 Wilder Terrace
- 78 Nelson St
- 114 Nelson St
- 117 Wilder Terrace
- 74 Nelson St
- 118 Wilder Terrace
- 77 Wilder Terrace
- 105 Van Horn St
- 12 Johnson St
- 80 Wilder Terrace
- 122 Nelson St
- 121 Wilder Terrace
Your Personal Tour Guide
Ask me questions while you tour the home.