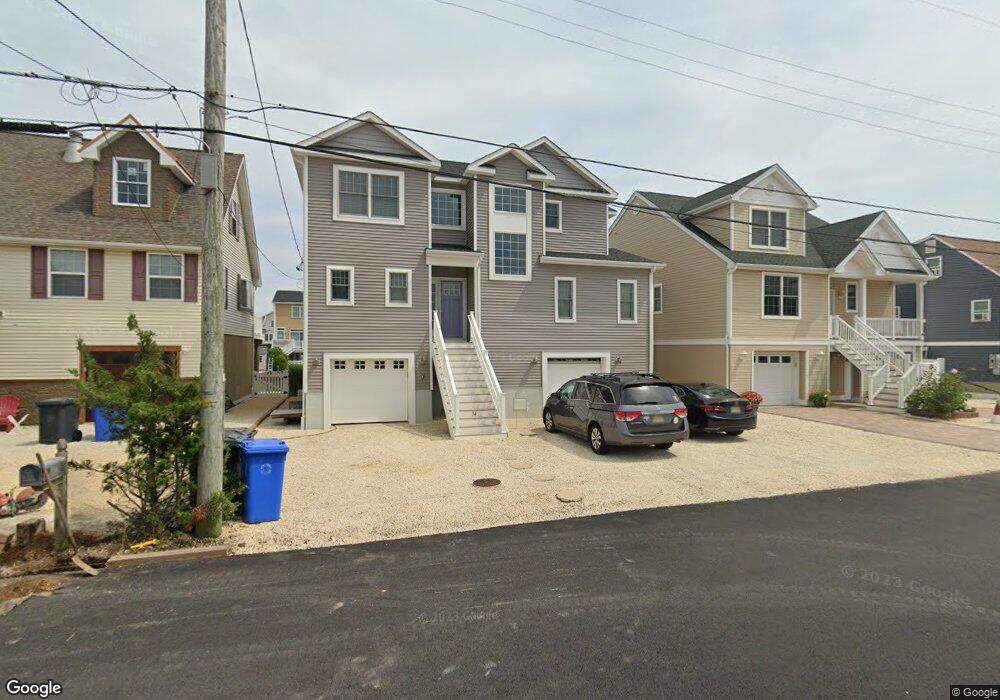
34 Joshua Dr Manahawkin, NJ 08050
Stafford NeighborhoodEstimated Value: $1,118,000 - $1,340,000
4
Beds
2
Baths
2,276
Sq Ft
$533/Sq Ft
Est. Value
About This Home
This home is located at 34 Joshua Dr, Manahawkin, NJ 08050 and is currently estimated at $1,212,573, approximately $532 per square foot. 34 Joshua Dr is a home located in Ocean County with nearby schools including Oxycocus Elementary School, Ocean Acres Elementary School, and McKinley Avenue Elementary School.
Ownership History
Date
Name
Owned For
Owner Type
Purchase Details
Closed on
Jun 4, 2010
Sold by
Mcdonald Michael and Mcdonald Deborah M
Bought by
Mancuso Richard and Mancuso Jane L
Current Estimated Value
Home Financials for this Owner
Home Financials are based on the most recent Mortgage that was taken out on this home.
Original Mortgage
$314,400
Outstanding Balance
$212,154
Interest Rate
5.11%
Mortgage Type
Stand Alone First
Estimated Equity
$1,000,419
Purchase Details
Closed on
Apr 15, 2005
Sold by
Cappiello David and Cappiello Pamela
Bought by
Mcdonald Deborah M and Mcdonald Michael
Create a Home Valuation Report for This Property
The Home Valuation Report is an in-depth analysis detailing your home's value as well as a comparison with similar homes in the area
Home Values in the Area
Average Home Value in this Area
Purchase History
| Date | Buyer | Sale Price | Title Company |
|---|---|---|---|
| Mancuso Richard | $393,000 | Colonial Title & Abstract Se | |
| Mcdonald Deborah M | $445,000 | -- |
Source: Public Records
Mortgage History
| Date | Status | Borrower | Loan Amount |
|---|---|---|---|
| Open | Mancuso Richard | $314,400 |
Source: Public Records
Tax History Compared to Growth
Tax History
| Year | Tax Paid | Tax Assessment Tax Assessment Total Assessment is a certain percentage of the fair market value that is determined by local assessors to be the total taxable value of land and additions on the property. | Land | Improvement |
|---|---|---|---|---|
| 2025 | $11,861 | $477,700 | $206,400 | $271,300 |
| 2024 | $11,747 | $477,700 | $206,400 | $271,300 |
| 2023 | $11,245 | $477,700 | $206,400 | $271,300 |
| 2022 | $11,245 | $477,700 | $206,400 | $271,300 |
| 2021 | $11,092 | $477,700 | $206,400 | $271,300 |
| 2020 | $11,107 | $477,700 | $206,400 | $271,300 |
| 2019 | $10,949 | $477,700 | $206,400 | $271,300 |
| 2018 | $10,882 | $477,700 | $206,400 | $271,300 |
| 2017 | $10,433 | $443,400 | $181,900 | $261,500 |
| 2016 | $10,327 | $443,400 | $181,900 | $261,500 |
| 2015 | $9,963 | $189,000 | $181,900 | $7,100 |
| 2014 | $4,304 | $189,200 | $179,100 | $10,100 |
Source: Public Records
Map
Nearby Homes