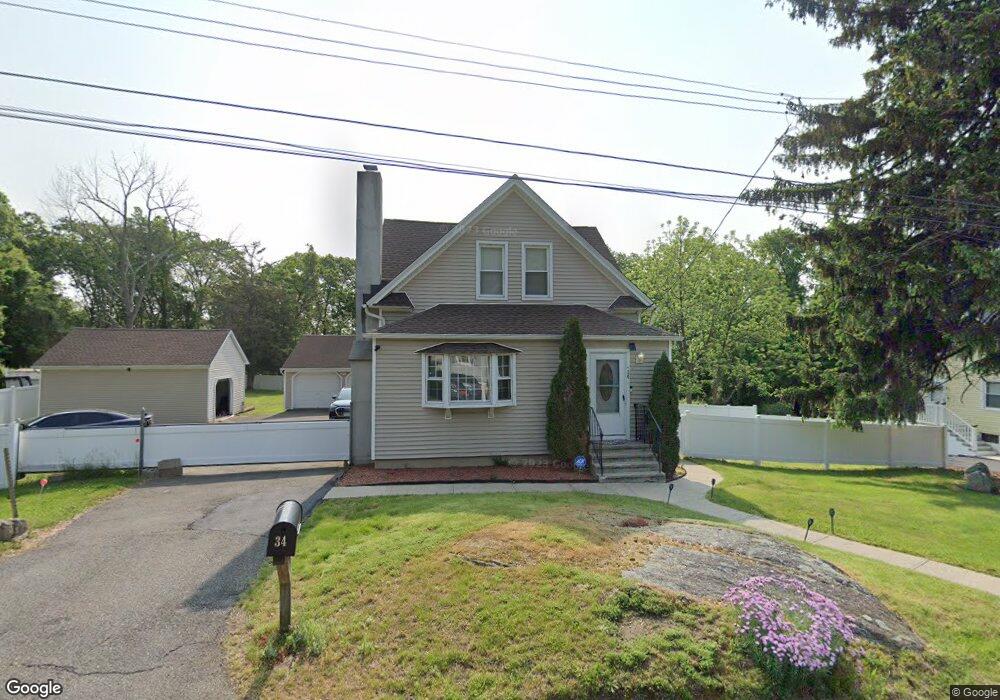
34 Lansing Ave Unit 2nd Trumbull, CT 06611
Trumbull Center NeighborhoodEstimated Value: $545,129 - $581,000
2
Beds
1
Bath
725
Sq Ft
$768/Sq Ft
Est. Value
About This Home
This home is located at 34 Lansing Ave Unit 2nd, Trumbull, CT 06611 and is currently estimated at $556,532, approximately $767 per square foot. 34 Lansing Ave Unit 2nd is a home located in Fairfield County with nearby schools including Booth Hill School, Hillcrest Middle School, and Trumbull High School.
Ownership History
Date
Name
Owned For
Owner Type
Purchase Details
Closed on
Sep 10, 2021
Sold by
5 Star Tlc T
Bought by
Stewart Rockeya
Current Estimated Value
Home Financials for this Owner
Home Financials are based on the most recent Mortgage that was taken out on this home.
Original Mortgage
$405,519
Outstanding Balance
$368,992
Interest Rate
2.8%
Mortgage Type
FHA
Estimated Equity
$187,540
Purchase Details
Closed on
Jun 23, 2019
Sold by
Simms Enaroy
Bought by
5 Star Tlc T
Purchase Details
Closed on
Aug 22, 2013
Sold by
34 Lansing Llc
Bought by
Simms Enaroy
Home Financials for this Owner
Home Financials are based on the most recent Mortgage that was taken out on this home.
Original Mortgage
$270,019
Interest Rate
4.4%
Mortgage Type
FHA
Purchase Details
Closed on
Oct 6, 2010
Sold by
Bac Home Loans Svcng L
Bought by
Federal National Mortgage Association
Purchase Details
Closed on
May 26, 2000
Sold by
Rural Water Co Inc
Bought by
Jmr Constr Inc
Create a Home Valuation Report for This Property
The Home Valuation Report is an in-depth analysis detailing your home's value as well as a comparison with similar homes in the area
Home Values in the Area
Average Home Value in this Area
Purchase History
| Date | Buyer | Sale Price | Title Company |
|---|---|---|---|
| Stewart Rockeya | $413,000 | None Available | |
| 5 Star Tlc T | -- | -- | |
| Simms Enaroy | $275,000 | -- | |
| 34 Lansing Llc | -- | -- | |
| Federal National Mortgage Association | -- | -- | |
| Bac Home Loans Svcng L | -- | -- | |
| Jmr Constr Inc | $60,000 | -- |
Source: Public Records
Mortgage History
| Date | Status | Borrower | Loan Amount |
|---|---|---|---|
| Open | Stewart Rockeya | $405,519 | |
| Previous Owner | Jmr Constr Inc | $255,392 | |
| Previous Owner | Jmr Constr Inc | $270,019 |
Source: Public Records
Tax History
| Year | Tax Paid | Tax Assessment Tax Assessment Total Assessment is a certain percentage of the fair market value that is determined by local assessors to be the total taxable value of land and additions on the property. | Land | Improvement |
|---|---|---|---|---|
| 2025 | $9,924 | $268,800 | $118,580 | $150,220 |
| 2024 | $9,653 | $268,800 | $118,580 | $150,220 |
| 2023 | $9,497 | $268,800 | $118,580 | $150,220 |
| 2022 | $9,345 | $268,800 | $118,580 | $150,220 |
| 2021 | $8,096 | $225,820 | $80,850 | $144,970 |
| 2020 | $8,096 | $225,820 | $80,850 | $144,970 |
| 2018 | $7,896 | $225,820 | $80,850 | $144,970 |
| 2017 | $7,149 | $208,670 | $80,850 | $127,820 |
| 2016 | $7,005 | $208,670 | $80,850 | $127,820 |
| 2015 | $7,088 | $208,700 | $80,900 | $127,800 |
| 2014 | $6,935 | $208,700 | $80,900 | $127,800 |
Source: Public Records
Map
Nearby Homes
- 46 Oakleaf St
- 250 Dayton Rd
- 181 Cityview Ave
- 285 Hillcrest Rd
- 438 Soundview Ave
- 207 Hillcrest Rd
- 123 Beverly Dr
- 165 Yaremich Dr
- 717 Reservoir Ave
- 705 Reservoir Ave
- 82 Yaremich Dr
- 85 Platt St
- 26 Karen Ct Unit A
- 9 Sunnyridge Pkwy
- 769 Sylvan Ave Unit 13
- 940 Reservoir Ave
- 119 Jennings Ave
- 110 Wilkins Ave
- 28 Wilkins Ave
- 274 Platt St
Your Personal Tour Guide
Ask me questions while you tour the home.