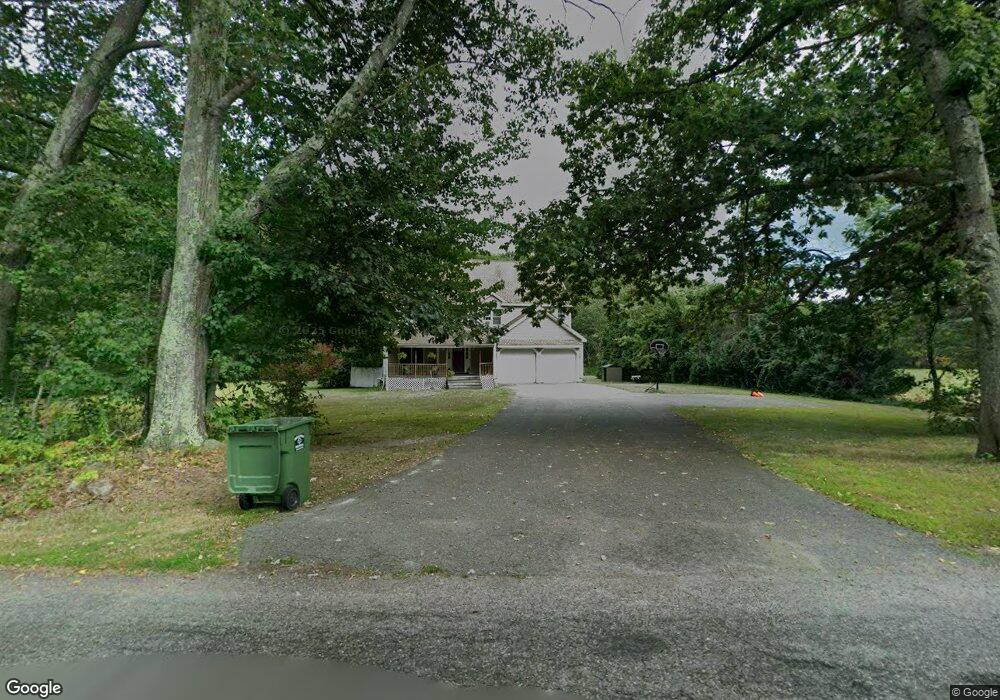
34 Lashua Rd Ashburnham, MA 01430
Estimated Value: $546,000 - $615,000
3
Beds
4
Baths
2,484
Sq Ft
$230/Sq Ft
Est. Value
About This Home
This home is located at 34 Lashua Rd, Ashburnham, MA 01430 and is currently estimated at $570,991, approximately $229 per square foot. 34 Lashua Rd is a home located in Worcester County with nearby schools including Oakmont Regional High School and Cushing Academy.
Ownership History
Date
Name
Owned For
Owner Type
Purchase Details
Closed on
Jun 16, 2004
Sold by
Sears Keith M and Sears Tracy L
Bought by
Peterson James and Peterson Kristin E
Current Estimated Value
Home Financials for this Owner
Home Financials are based on the most recent Mortgage that was taken out on this home.
Original Mortgage
$312,500
Interest Rate
6.12%
Mortgage Type
Purchase Money Mortgage
Create a Home Valuation Report for This Property
The Home Valuation Report is an in-depth analysis detailing your home's value as well as a comparison with similar homes in the area
Home Values in the Area
Average Home Value in this Area
Purchase History
| Date | Buyer | Sale Price | Title Company |
|---|---|---|---|
| Peterson James | $306,500 | -- | |
| Peterson James | $306,500 | -- |
Source: Public Records
Mortgage History
| Date | Status | Borrower | Loan Amount |
|---|---|---|---|
| Open | Peterson James | $240,788 | |
| Closed | Peterson James | $312,500 |
Source: Public Records
Tax History Compared to Growth
Tax History
| Year | Tax Paid | Tax Assessment Tax Assessment Total Assessment is a certain percentage of the fair market value that is determined by local assessors to be the total taxable value of land and additions on the property. | Land | Improvement |
|---|---|---|---|---|
| 2025 | $7,787 | $523,700 | $43,600 | $480,100 |
| 2024 | $7,390 | $469,200 | $43,600 | $425,600 |
| 2023 | $7,294 | $440,700 | $43,600 | $397,100 |
| 2022 | $7,152 | $378,800 | $42,700 | $336,100 |
| 2021 | $7,784 | $378,800 | $42,700 | $336,100 |
| 2020 | $5,797 | $378,800 | $42,700 | $336,100 |
| 2019 | $7,938 | $352,000 | $42,700 | $309,300 |
| 2018 | $5,541 | $346,900 | $40,800 | $306,100 |
| 2017 | $5,386 | $342,700 | $39,800 | $302,900 |
| 2016 | $7,569 | $332,700 | $38,900 | $293,800 |
| 2015 | $7,413 | $332,700 | $38,900 | $293,800 |
Source: Public Records
Map
Nearby Homes
- 18 Corey Hill Rd
- 9 Willard Rd
- Lot 40C Winchendon Rd
- 30 Russell Hill Rd
- 40 Hunter Ave
- 152 Ashby Rd
- 136 Willard Rd
- 101 Russell Hill Rd
- Lot 3 W State Rd
- 179 Cashman Hill Rd
- 6 Wyman Rd
- 66 S Main St
- 189 Fitchburg Rd
- 134 Stodge Meadow Rd
- 358 Winchendon Rd
- 0 Holt Rd
- 232 Sherbert Rd
- 84 Murray Rd
- 13 Browns Lake Rd
- 15 Kirali Ct