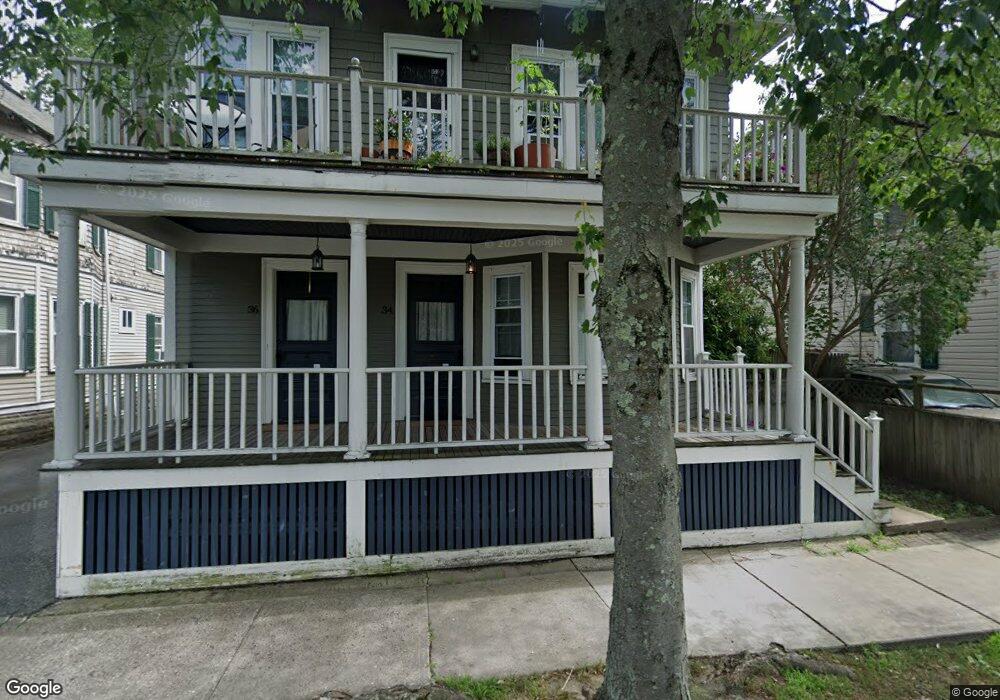
34 Leach St Salem, MA 01970
South Salem NeighborhoodEstimated Value: $763,983 - $853,000
6
Beds
2
Baths
2,922
Sq Ft
$280/Sq Ft
Est. Value
About This Home
This home is located at 34 Leach St, Salem, MA 01970 and is currently estimated at $819,496, approximately $280 per square foot. 34 Leach St is a home located in Essex County with nearby schools including Saltonstall School, Carlton Elementary School, and Bates Elementary School.
Ownership History
Date
Name
Owned For
Owner Type
Purchase Details
Closed on
Feb 27, 2009
Sold by
Ramos Leach Street T
Bought by
White Ryan Patrick
Current Estimated Value
Home Financials for this Owner
Home Financials are based on the most recent Mortgage that was taken out on this home.
Original Mortgage
$286,629
Interest Rate
5%
Mortgage Type
Purchase Money Mortgage
Create a Home Valuation Report for This Property
The Home Valuation Report is an in-depth analysis detailing your home's value as well as a comparison with similar homes in the area
Home Values in the Area
Average Home Value in this Area
Purchase History
| Date | Buyer | Sale Price | Title Company |
|---|---|---|---|
| White Ryan Patrick | $292,000 | -- |
Source: Public Records
Mortgage History
| Date | Status | Borrower | Loan Amount |
|---|---|---|---|
| Open | White Ryan Patrick | $271,000 | |
| Closed | White Ryan Patrick | $286,629 |
Source: Public Records
Tax History
| Year | Tax Paid | Tax Assessment Tax Assessment Total Assessment is a certain percentage of the fair market value that is determined by local assessors to be the total taxable value of land and additions on the property. | Land | Improvement |
|---|---|---|---|---|
| 2025 | $7,473 | $659,000 | $196,900 | $462,100 |
| 2024 | $7,127 | $613,300 | $187,100 | $426,200 |
| 2023 | $6,888 | $550,600 | $172,700 | $377,900 |
| 2022 | $7,076 | $534,000 | $167,000 | $367,000 |
| 2021 | $6,701 | $485,600 | $155,500 | $330,100 |
| 2020 | $6,581 | $455,400 | $146,800 | $308,600 |
| 2019 | $6,511 | $431,200 | $139,300 | $291,900 |
| 2018 | $6,012 | $390,900 | $132,400 | $258,500 |
| 2017 | $5,607 | $353,500 | $111,700 | $241,800 |
| 2016 | $5,458 | $348,300 | $106,500 | $241,800 |
| 2015 | $5,299 | $322,900 | $97,900 | $225,000 |
Source: Public Records
Map
Nearby Homes
- 25 Eden St Unit 2
- 4 Willow Ave Unit 2
- 9 Glover St Unit 1
- 5 Gardner St Unit 3
- 29 Ocean Ave Unit 4
- 3 Chase St
- 1 Shore Ave
- 10 Hazel St Unit 2
- 6R Hazel Terrace Unit 1
- 7 Fairfield St
- 185 Lafayette St Unit 3
- 17 Palmer St
- 65 Palmer St Unit 3
- 88 Congress St Unit 3
- 22 Prescott St Unit 1
- 86 Wharf St Unit 6
- 4 Fairview Rd
- 106 Broadway Unit 3
- 225 Derby St Unit 503
- 15 Francis Rd
- 38 Leach St Unit 40
- 30 Leach St
- 30 Leach St Unit 1
- 1 Summit Ave
- 44 Leach St
- 42 Leach St Unit 4
- 42 Leach St Unit 44
- 42-44 Leach St
- 3 Eden St
- 5 Summit Ave
- 5 Summit Ave Unit 1
- 7 Eden St
- 29 Leach St Unit 4
- 29 Leach St Unit 3
- 29 Leach St Unit 2
- 29 Leach St Unit 1
- 48 Leach St Unit 2
- 48 Leach St Unit 1
- 46 Leach St Unit 1
- 46 Leach St
Your Personal Tour Guide
Ask me questions while you tour the home.