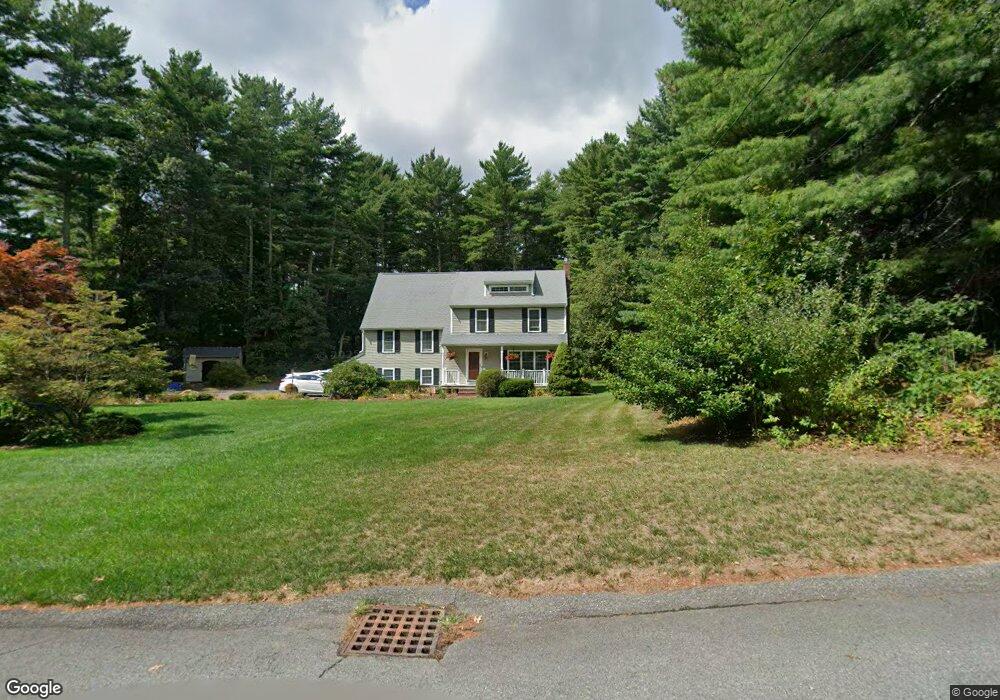
34 Leonard St Carver, MA 02330
Estimated Value: $614,000 - $737,393
4
Beds
3
Baths
2,056
Sq Ft
$339/Sq Ft
Est. Value
About This Home
This home is located at 34 Leonard St, Carver, MA 02330 and is currently estimated at $696,098, approximately $338 per square foot. 34 Leonard St is a home located in Plymouth County with nearby schools including Carver Elementary School and Samuel Fuller School.
Ownership History
Date
Name
Owned For
Owner Type
Purchase Details
Closed on
Nov 1, 2011
Sold by
Harrison Richard W
Bought by
Harrison Richard W and Harrison Denise S
Current Estimated Value
Home Financials for this Owner
Home Financials are based on the most recent Mortgage that was taken out on this home.
Original Mortgage
$300,000
Outstanding Balance
$205,458
Interest Rate
4.11%
Mortgage Type
Stand Alone Second
Estimated Equity
$490,640
Purchase Details
Closed on
Aug 11, 1995
Sold by
Arruda Joseph M and Arruda Andrea M
Bought by
Harrison Richard W and Cushman Denise S
Purchase Details
Closed on
Jan 21, 1992
Sold by
Citicorp Mtg Inc
Bought by
Arruda Joseph M and Arruda Andrea M
Purchase Details
Closed on
Nov 18, 1991
Sold by
Kelly Justin F
Bought by
Citicorp Mtg Corp
Purchase Details
Closed on
Feb 24, 1989
Sold by
Village Homes Inc
Bought by
Kelly Justin F
Create a Home Valuation Report for This Property
The Home Valuation Report is an in-depth analysis detailing your home's value as well as a comparison with similar homes in the area
Home Values in the Area
Average Home Value in this Area
Purchase History
| Date | Buyer | Sale Price | Title Company |
|---|---|---|---|
| Harrison Richard W | -- | -- | |
| Harrison Richard W | $157,000 | -- | |
| Arruda Joseph M | $145,000 | -- | |
| Citicorp Mtg Corp | $115,500 | -- | |
| Kelly Justin F | $199,999 | -- |
Source: Public Records
Mortgage History
| Date | Status | Borrower | Loan Amount |
|---|---|---|---|
| Open | Harrison Richard W | $300,000 | |
| Previous Owner | Kelly Justin F | $250,000 | |
| Previous Owner | Kelly Justin F | $40,000 |
Source: Public Records
Tax History Compared to Growth
Tax History
| Year | Tax Paid | Tax Assessment Tax Assessment Total Assessment is a certain percentage of the fair market value that is determined by local assessors to be the total taxable value of land and additions on the property. | Land | Improvement |
|---|---|---|---|---|
| 2025 | $8,579 | $618,500 | $142,100 | $476,400 |
| 2024 | $8,054 | $568,400 | $139,300 | $429,100 |
| 2023 | $7,782 | $533,400 | $139,300 | $394,100 |
| 2022 | $7,349 | $459,900 | $119,100 | $340,800 |
| 2021 | $7,291 | $430,400 | $106,300 | $324,100 |
| 2020 | $6,946 | $404,100 | $99,400 | $304,700 |
| 2019 | $15,431 | $408,400 | $96,500 | $311,900 |
| 2018 | $15,265 | $377,400 | $96,500 | $280,900 |
| 2017 | $6,593 | $372,700 | $92,800 | $279,900 |
| 2016 | $6,066 | $356,200 | $88,400 | $267,800 |
| 2015 | $5,918 | $347,900 | $88,400 | $259,500 |
| 2014 | $5,435 | $319,500 | $111,800 | $207,700 |
Source: Public Records
Map
Nearby Homes
- 26 Santana Way Unit 26
- 7 Green St
- 11 Brockton Ave
- 135 Plymouth St
- 23 Shaw St
- Lot1 Elk Run Dr
- 6 Susan Cir
- 35 Silva St
- 141 Rocky Meadow St
- 759 Plymouth St
- 162 Plympton St
- 269 Purchase St
- 81 Center St
- 122 High St
- 64 Wenham Rd
- 20 Spring St
- 714 Plymouth St
- 18 Russell Holmes Way
- 6 Kestrel Way
- 9 Terrace Way
- 36 Leonard St
- 32 Leonard St
- 35 Leonard St
- 38 Leonard St
- 20 Lillian Way
- 30 Leonard St
- 19 Lillian Way
- 31 Leonard St
- 37 Leonard St
- 39 Leonard St
- 29 Leonard St
- 28 Leonard St
- 40 Leonard St
- 17 Lillian Way
- 14 Santana Way Unit 14
- 13 Santana Way Unit 13
- 12 Santana Way Unit 12
- 16 Lillian Way
- 17 Santana Way Unit 17
- 16 Santana Way Unit 16