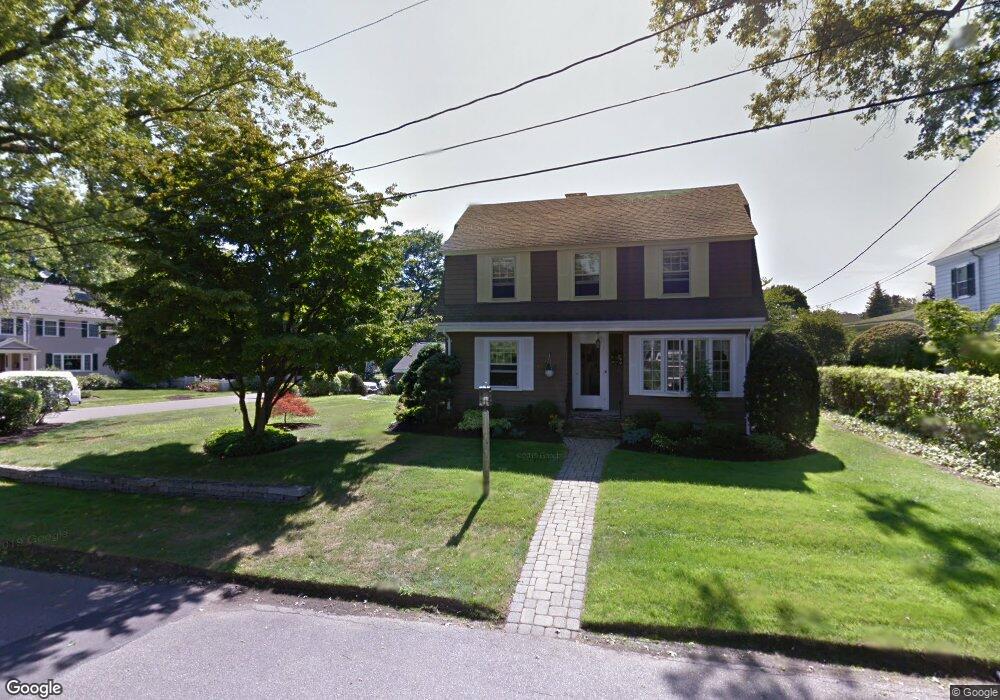
34 Locust St Marblehead, MA 01945
Estimated Value: $1,436,000 - $2,031,000
4
Beds
4
Baths
4,418
Sq Ft
$399/Sq Ft
Est. Value
About This Home
This home is located at 34 Locust St, Marblehead, MA 01945 and is currently estimated at $1,764,343, approximately $399 per square foot. 34 Locust St is a home located in Essex County with nearby schools including Marblehead High School, Devereux School, and Tower School.
Ownership History
Date
Name
Owned For
Owner Type
Purchase Details
Closed on
Jun 1, 2023
Sold by
34 Locust Street Llc
Bought by
Mccarthy Lindsey and Mccarthy Matthew
Current Estimated Value
Purchase Details
Closed on
Apr 29, 2022
Sold by
Mccarthy Lindsey and Mccarthy Matthew
Bought by
34 Locust Street Llc
Purchase Details
Closed on
Oct 14, 2021
Sold by
Albury Laurie A
Bought by
Mccarthy Lindsey and Mccarthy Matthew
Purchase Details
Closed on
Jun 29, 2020
Sold by
Ward Marjorie M
Bought by
Albury Laurie A and Ward Marjorie M
Purchase Details
Closed on
Nov 1, 1989
Sold by
Ayer John
Bought by
Ward Marjorie Marie
Home Financials for this Owner
Home Financials are based on the most recent Mortgage that was taken out on this home.
Original Mortgage
$187,600
Interest Rate
9.9%
Mortgage Type
Purchase Money Mortgage
Create a Home Valuation Report for This Property
The Home Valuation Report is an in-depth analysis detailing your home's value as well as a comparison with similar homes in the area
Home Values in the Area
Average Home Value in this Area
Purchase History
| Date | Buyer | Sale Price | Title Company |
|---|---|---|---|
| Mccarthy Lindsey | -- | None Available | |
| Mccarthy Lindsey | -- | None Available | |
| Mccarthy Lindsey | -- | None Available | |
| 34 Locust Street Llc | -- | None Available | |
| 34 Locust Street Llc | -- | None Available | |
| 34 Locust Street Llc | -- | None Available | |
| Mccarthy Lindsey | $1,020,000 | None Available | |
| Albury Laurie A | -- | None Available | |
| Albury Laurie A | -- | None Available | |
| Albury Laurie A | -- | None Available | |
| Ward Marjorie Marie | $277,000 | -- |
Source: Public Records
Mortgage History
| Date | Status | Borrower | Loan Amount |
|---|---|---|---|
| Previous Owner | Ward Marjorie Marie | $187,600 |
Source: Public Records
Tax History
| Year | Tax Paid | Tax Assessment Tax Assessment Total Assessment is a certain percentage of the fair market value that is determined by local assessors to be the total taxable value of land and additions on the property. | Land | Improvement |
|---|---|---|---|---|
| 2025 | $15,545 | $1,717,700 | $927,500 | $790,200 |
| 2024 | $16,336 | $1,823,200 | $1,060,000 | $763,200 |
| 2023 | $10,770 | $1,077,000 | $861,300 | $215,700 |
| 2022 | $9,470 | $900,200 | $689,000 | $211,200 |
| 2021 | $9,349 | $897,200 | $689,000 | $208,200 |
| 2020 | $8,096 | $779,200 | $583,000 | $196,200 |
| 2019 | $8,002 | $745,100 | $556,500 | $188,600 |
| 2018 | $7,627 | $692,100 | $503,500 | $188,600 |
| 2017 | $7,183 | $652,400 | $463,800 | $188,600 |
| 2016 | $7,073 | $637,200 | $450,500 | $186,700 |
| 2015 | $7,060 | $637,200 | $450,500 | $186,700 |
| 2014 | $6,951 | $626,800 | $450,500 | $176,300 |
Source: Public Records
Map
Nearby Homes
- 282 Pleasant St
- 23 Wyman Rd
- 34 Lafayette St
- 7 Cottage St
- 41 Atlantic Ave Unit 3
- 41 Atlantic Ave Unit 1
- 33 W Shore Dr
- 30 Haley Rd Unit 1
- 290 Washington St Unit A
- 4 Dean Rd
- 55 Brackett Place Unit B
- 6 Mount Vernon St
- 16 Pickwick Rd
- 12 Pickwick Rd
- 197A W Shore Dr Unit A
- 66 Pleasant St Unit 2
- 7 Lee St Unit 1
- 132 Elm St
- 132 Elm St Unit 132
- 26 Summer St Unit 1
Your Personal Tour Guide
Ask me questions while you tour the home.