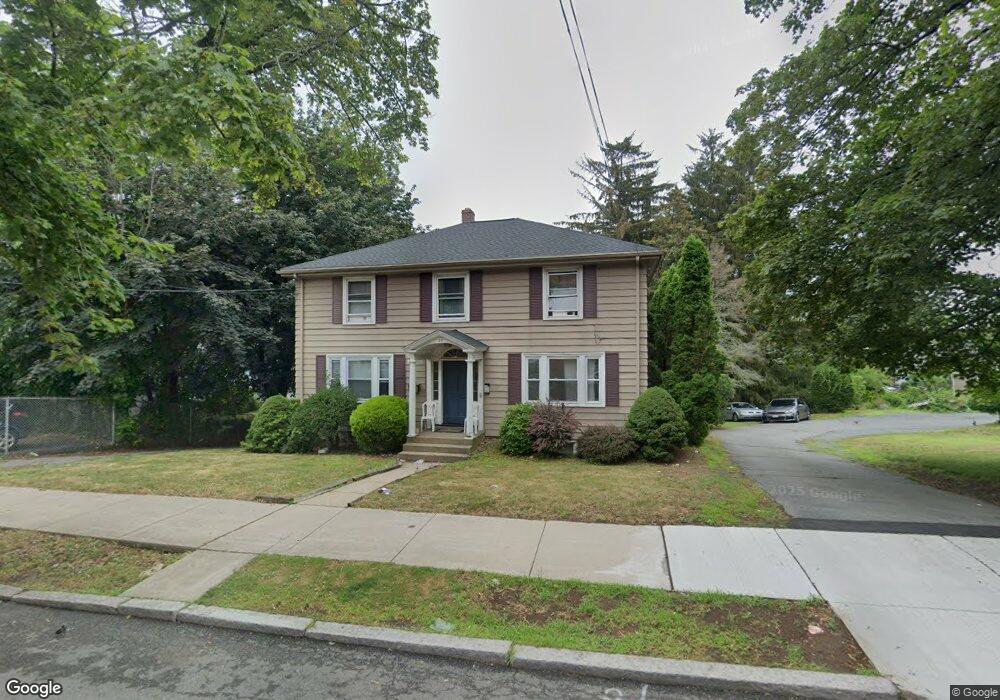
34 Lorning Ave Unit b Salem, MA 01970
South Salem NeighborhoodEstimated Value: $368,000 - $470,000
2
Beds
1
Bath
1,000
Sq Ft
$421/Sq Ft
Est. Value
About This Home
This home is located at 34 Lorning Ave Unit b, Salem, MA 01970 and is currently estimated at $421,353, approximately $421 per square foot. 34 Lorning Ave Unit b is a home located in Essex County with nearby schools including Saltonstall School, Horace Mann Laboratory, and Carlton Elementary School.
Ownership History
Date
Name
Owned For
Owner Type
Purchase Details
Closed on
Aug 15, 2013
Sold by
Goldstein Kathleen A and Goldstein Julie M
Bought by
Redcliff Group Llc
Current Estimated Value
Home Financials for this Owner
Home Financials are based on the most recent Mortgage that was taken out on this home.
Original Mortgage
$150,000
Interest Rate
4.31%
Mortgage Type
New Conventional
Purchase Details
Closed on
Sep 7, 2007
Sold by
Matthews Deborah J and Matthews Gene E
Bought by
Goldstein Elliot P and Kelly-Goldstein Kathleen
Home Financials for this Owner
Home Financials are based on the most recent Mortgage that was taken out on this home.
Original Mortgage
$188,000
Interest Rate
6.74%
Mortgage Type
Purchase Money Mortgage
Create a Home Valuation Report for This Property
The Home Valuation Report is an in-depth analysis detailing your home's value as well as a comparison with similar homes in the area
Home Values in the Area
Average Home Value in this Area
Purchase History
| Date | Buyer | Sale Price | Title Company |
|---|---|---|---|
| Redcliff Group Llc | $150,000 | -- | |
| Goldstein Elliot P | $235,000 | -- |
Source: Public Records
Mortgage History
| Date | Status | Borrower | Loan Amount |
|---|---|---|---|
| Closed | Goldstein Elliot P | $150,000 | |
| Previous Owner | Goldstein Elliot P | $188,000 | |
| Previous Owner | Goldstein Elliot P | $214,000 | |
| Previous Owner | Goldstein Elliot P | $166,000 |
Source: Public Records
Tax History
| Year | Tax Paid | Tax Assessment Tax Assessment Total Assessment is a certain percentage of the fair market value that is determined by local assessors to be the total taxable value of land and additions on the property. | Land | Improvement |
|---|---|---|---|---|
| 2025 | $4,307 | $379,800 | $0 | $379,800 |
| 2024 | $4,216 | $362,800 | $0 | $362,800 |
| 2023 | $4,217 | $337,100 | $0 | $337,100 |
| 2022 | $4,073 | $307,400 | $0 | $307,400 |
| 2021 | $3,834 | $277,800 | $0 | $277,800 |
| 2020 | $3,701 | $256,100 | $0 | $256,100 |
| 2019 | $3,535 | $234,100 | $0 | $234,100 |
| 2018 | $3,410 | $221,700 | $0 | $221,700 |
| 2017 | $3,327 | $209,800 | $0 | $209,800 |
| 2016 | $3,156 | $201,400 | $0 | $201,400 |
| 2015 | $3,136 | $191,100 | $0 | $191,100 |
Source: Public Records
Map
Nearby Homes
- 106 Broadway Unit 3
- 24 Wisteria St Unit 2
- 326 Lafayette St Unit 2
- 4 Fairview Rd
- 29 Ocean Ave Unit 4
- 79 Lawrence St
- 263 Jefferson Ave
- 259 Jefferson Ave
- 1 Shore Ave
- 4 Willow Ave Unit 2
- 6 Arthur St Unit 3
- 23 Marion Rd Unit B
- 10 Hazel St Unit 2
- 6R Hazel Terrace Unit 1
- 13 Roslyn St Unit 2
- 29 Willson St
- 9 Glover St Unit 1
- 59 Leach St Unit 2
- 28 Surrey Rd
- 7 Fairfield St
- 30 Loring Ave Unit B
- 30 Loring Ave Unit A
- 28 Loring Ave
- 34 Loring Ave Unit B
- 34 Loring Ave Unit A
- 43 Charles St Unit G4
- 43 Charles St Unit G3
- 43 Charles St Unit G2
- 43 Charles St Unit G1
- 43 Charles St
- 43 Charles St
- 26 Loring Ave
- 37 Charles St
- 36 Loring Ave
- 24 Loring Ave
- 24 Loring Ave Unit 1A
- 24 Loring Ave Unit 2B
- 24 Loring Ave
- 33 Charles St
- 51 Charles St
Your Personal Tour Guide
Ask me questions while you tour the home.