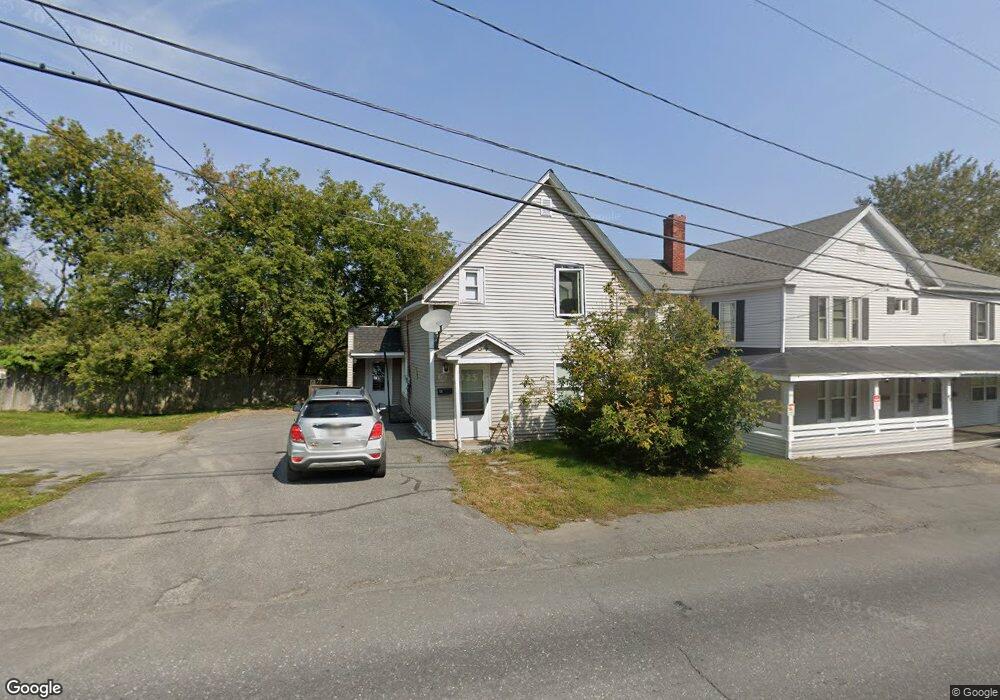
34 Lyndon St Caribou, ME 04736
Estimated Value: $124,872 - $232,000
--
Bed
--
Bath
924
Sq Ft
$174/Sq Ft
Est. Value
About This Home
This home is located at 34 Lyndon St, Caribou, ME 04736 and is currently estimated at $160,718, approximately $173 per square foot. 34 Lyndon St is a home.
Ownership History
Date
Name
Owned For
Owner Type
Purchase Details
Closed on
Apr 12, 2024
Sold by
L & R Associates Llc
Bought by
Saucier Property Mgmt Llc
Current Estimated Value
Home Financials for this Owner
Home Financials are based on the most recent Mortgage that was taken out on this home.
Original Mortgage
$28,050
Outstanding Balance
$27,610
Interest Rate
6.94%
Mortgage Type
Purchase Money Mortgage
Estimated Equity
$133,108
Purchase Details
Closed on
Aug 1, 2013
Sold by
Forbes Debra A
Bought by
Forbes Bryan L
Purchase Details
Closed on
Aug 25, 2005
Sold by
Forbes Bryan L
Bought by
Forbes Bryan L and Forbes Debra A
Home Financials for this Owner
Home Financials are based on the most recent Mortgage that was taken out on this home.
Original Mortgage
$157,500
Interest Rate
5.68%
Mortgage Type
Purchase Money Mortgage
Create a Home Valuation Report for This Property
The Home Valuation Report is an in-depth analysis detailing your home's value as well as a comparison with similar homes in the area
Home Values in the Area
Average Home Value in this Area
Purchase History
| Date | Buyer | Sale Price | Title Company |
|---|---|---|---|
| Saucier Property Mgmt Llc | -- | None Available | |
| Saucier Property Mgmt Llc | -- | None Available | |
| Forbes Bryan L | -- | -- | |
| Forbes Bryan L | -- | -- | |
| Forbes Bryan L | -- | -- | |
| Forbes Bryan L | -- | -- | |
| Forbes Bryan L | -- | -- |
Source: Public Records
Mortgage History
| Date | Status | Borrower | Loan Amount |
|---|---|---|---|
| Open | Saucier Property Mgmt Llc | $28,050 | |
| Closed | Saucier Property Mgmt Llc | $28,050 | |
| Previous Owner | Forbes Bryan L | $104,000 | |
| Previous Owner | Forbes Bryan L | $157,500 |
Source: Public Records
Tax History Compared to Growth
Tax History
| Year | Tax Paid | Tax Assessment Tax Assessment Total Assessment is a certain percentage of the fair market value that is determined by local assessors to be the total taxable value of land and additions on the property. | Land | Improvement |
|---|---|---|---|---|
| 2024 | $2,211 | $103,300 | $11,500 | $91,800 |
| 2023 | $1,279 | $65,600 | $11,500 | $54,100 |
| 2022 | $1,149 | $48,800 | $10,000 | $38,800 |
| 2021 | $1,149 | $48,800 | $10,000 | $38,800 |
| 2020 | $1,149 | $48,800 | $10,000 | $38,800 |
| 2019 | $1,198 | $48,800 | $10,000 | $38,800 |
| 2018 | $1,157 | $48,800 | $10,000 | $38,800 |
| 2017 | $1,166 | $48,800 | $10,000 | $38,800 |
| 2016 | $1,118 | $48,800 | $10,000 | $38,800 |
| 2015 | $1,096 | $48,800 | $10,000 | $38,800 |
| 2014 | $1,088 | $48,800 | $10,000 | $38,800 |
Source: Public Records
Map
Nearby Homes