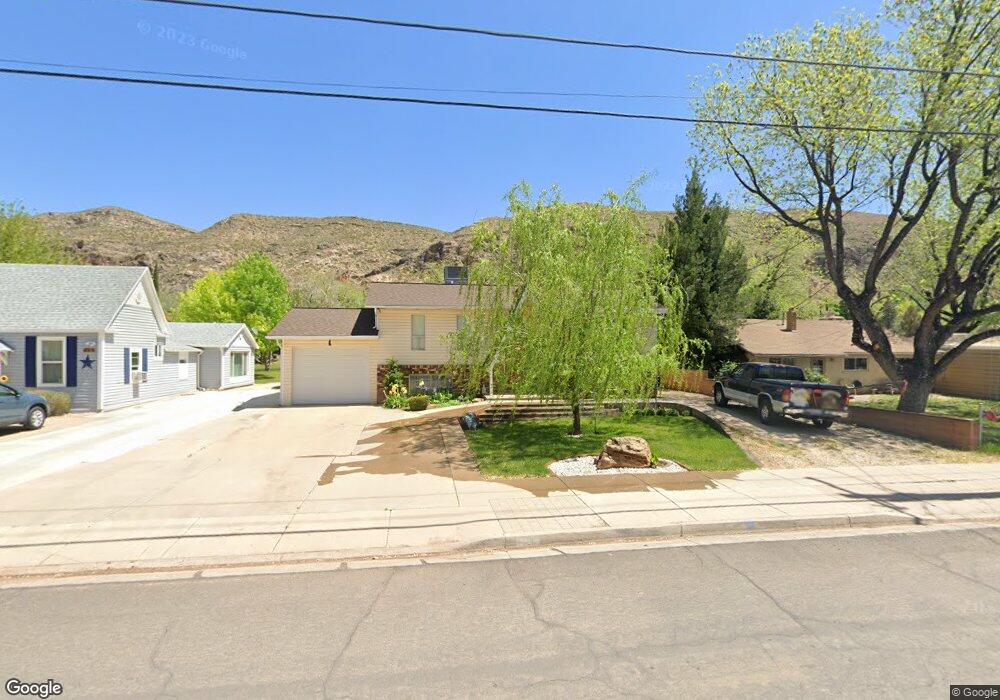
34 N Main St La Verkin, UT 84745
Estimated Value: $458,000 - $481,000
4
Beds
2
Baths
2,316
Sq Ft
$202/Sq Ft
Est. Value
About This Home
This home is located at 34 N Main St, La Verkin, UT 84745 and is currently estimated at $468,234, approximately $202 per square foot. 34 N Main St is a home located in Washington County with nearby schools including La Verkin Elementary School, Hurricane Middle School, and Hurricane High School.
Ownership History
Date
Name
Owned For
Owner Type
Purchase Details
Closed on
Apr 30, 2025
Sold by
Thompson Bobby G
Bought by
Bobby Thompson Trust and Thompson
Current Estimated Value
Purchase Details
Closed on
Oct 7, 2016
Sold by
Clarence Dale Burton
Bought by
Thompson Bobby and Thompson Becky
Home Financials for this Owner
Home Financials are based on the most recent Mortgage that was taken out on this home.
Original Mortgage
$214,864
Interest Rate
3.42%
Purchase Details
Closed on
May 29, 2009
Sold by
Burton Clarence D
Bought by
Burton Clarence Dale and Clarence Dale Burton Revocable
Create a Home Valuation Report for This Property
The Home Valuation Report is an in-depth analysis detailing your home's value as well as a comparison with similar homes in the area
Home Values in the Area
Average Home Value in this Area
Purchase History
| Date | Buyer | Sale Price | Title Company |
|---|---|---|---|
| Bobby Thompson Trust | -- | None Listed On Document | |
| Thompson Bobby | -- | -- | |
| Burton Clarence Dale | -- | None Available |
Source: Public Records
Mortgage History
| Date | Status | Borrower | Loan Amount |
|---|---|---|---|
| Previous Owner | Thompson Bobby | $214,864 | |
| Previous Owner | Thompson Bobby | -- |
Source: Public Records
Tax History Compared to Growth
Tax History
| Year | Tax Paid | Tax Assessment Tax Assessment Total Assessment is a certain percentage of the fair market value that is determined by local assessors to be the total taxable value of land and additions on the property. | Land | Improvement |
|---|---|---|---|---|
| 2025 | $1,861 | $245,740 | $66,000 | $179,740 |
| 2023 | $1,780 | $236,005 | $66,000 | $170,005 |
| 2022 | $1,874 | $233,915 | $44,000 | $189,915 |
| 2021 | $1,687 | $309,900 | $60,000 | $249,900 |
| 2020 | $1,532 | $263,200 | $60,000 | $203,200 |
| 2019 | $1,585 | $261,000 | $45,000 | $216,000 |
| 2018 | $1,476 | $119,680 | $0 | $0 |
| 2017 | $1,465 | $118,800 | $0 | $0 |
| 2016 | $1,404 | $109,285 | $0 | $0 |
| 2015 | $1,319 | $98,725 | $0 | $0 |
| 2014 | $1,146 | $84,590 | $0 | $0 |
Source: Public Records
Map
Nearby Homes
- 728 N 15 W
- 65 S Main St
- 80 W Center St Unit 13
- 0 Lot #1 Valle Vista Unit 25-262463
- 0 Lot #4 Valle Vista Unit 25-262467
- 0 Vista Unit 25-262466
- 163 N 70 E
- 0 Lot #2 Valle Vista Unit 25-262464
- 161 E 130 N
- 0 La Verkin Lot Unit 24-252790
- 140 S 100 W
- 57 W 180 S
- 200 N State St
- 235 N 200 E
- 235 N 200 E Unit 55
- 31 Webb
- 233 N State St
- 72 S 250 W
- 24 Wanda
- 237 N 220 W