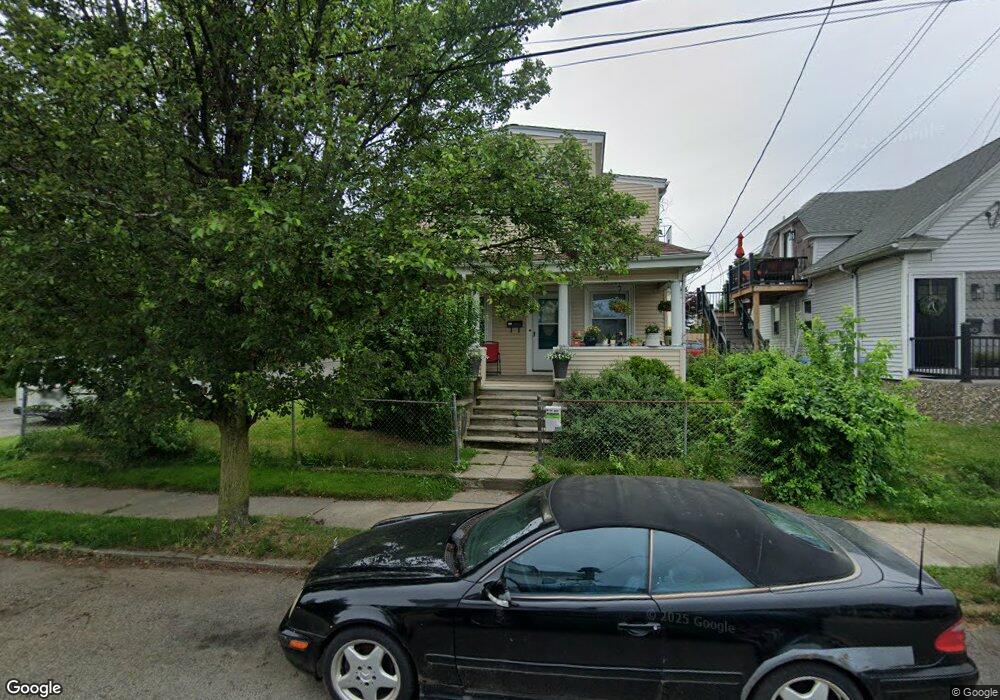
34 N Sharon St East Providence, RI 02914
Estimated Value: $425,534 - $526,000
5
Beds
2
Baths
1,920
Sq Ft
$259/Sq Ft
Est. Value
About This Home
This home is located at 34 N Sharon St, East Providence, RI 02914 and is currently estimated at $496,634, approximately $258 per square foot. 34 N Sharon St is a home located in Providence County with nearby schools including East Providence High School, Ocean State Montessori School, and The Gordon School.
Ownership History
Date
Name
Owned For
Owner Type
Purchase Details
Closed on
Feb 17, 2005
Sold by
M A Mangione Inc
Bought by
Mabrouk Ashy
Current Estimated Value
Home Financials for this Owner
Home Financials are based on the most recent Mortgage that was taken out on this home.
Original Mortgage
$120,000
Interest Rate
5.78%
Mortgage Type
Purchase Money Mortgage
Purchase Details
Closed on
Jun 15, 2004
Sold by
Silva John
Bought by
Ma Mangone Inc
Create a Home Valuation Report for This Property
The Home Valuation Report is an in-depth analysis detailing your home's value as well as a comparison with similar homes in the area
Home Values in the Area
Average Home Value in this Area
Purchase History
| Date | Buyer | Sale Price | Title Company |
|---|---|---|---|
| Mabrouk Ashy | $285,000 | -- | |
| Mabrouk Ashy | $285,000 | -- | |
| Ma Mangone Inc | $200,000 | -- | |
| Ma Mangone Inc | $200,000 | -- |
Source: Public Records
Mortgage History
| Date | Status | Borrower | Loan Amount |
|---|---|---|---|
| Open | Silva John | $137,000 | |
| Closed | Silva John | $120,000 | |
| Previous Owner | Silva John | $97,500 |
Source: Public Records
Tax History Compared to Growth
Tax History
| Year | Tax Paid | Tax Assessment Tax Assessment Total Assessment is a certain percentage of the fair market value that is determined by local assessors to be the total taxable value of land and additions on the property. | Land | Improvement |
|---|---|---|---|---|
| 2024 | $5,076 | $331,100 | $75,000 | $256,100 |
| 2023 | $4,887 | $331,100 | $75,000 | $256,100 |
| 2022 | $3,950 | $180,700 | $41,600 | $139,100 |
| 2021 | $3,885 | $180,700 | $40,100 | $140,600 |
| 2020 | $3,721 | $180,700 | $40,100 | $140,600 |
| 2019 | $3,618 | $180,700 | $40,100 | $140,600 |
| 2018 | $3,617 | $158,100 | $41,900 | $116,200 |
| 2017 | $3,537 | $158,100 | $41,900 | $116,200 |
| 2016 | $3,519 | $158,100 | $41,900 | $116,200 |
| 2015 | $3,534 | $154,000 | $33,900 | $120,100 |
| 2014 | $3,534 | $154,000 | $33,900 | $120,100 |
Source: Public Records
Map
Nearby Homes
- 15 S Carpenter St
- 152 Freeborn Ave
- 322 Mauran Ave
- 318 Mauran Ave
- 38 N Prospect St
- 78 Ingraham St
- 43 Mary Ave Unit 45
- 320 Mauran Ave
- 400 Juniper St Unit C
- 400 Juniper St Unit B
- 400 Juniper St Unit A
- 0 Juniper St
- 134 Berkeley St
- 1123 S Broadway
- 91 Ivy St
- 195 Lyon Ave Unit 197
- 89 Warren Ave
- 77 Seventh St
- 168 Waterman Ave
- 58 Summit St
- 40 N Sharon St Unit 40
- 38 N Sharon St
- 196 Freeborn Ave
- 42 N Sharon St Unit 44
- 35 N Sharon St
- 37 N Sharon St
- 186 Freeborn Ave Unit 2
- 184 Freeborn Ave Unit 186
- 39 N Sharon St Unit 41
- 180 Freeborn Ave
- 183 Orchard St
- 185 Orchard St Unit 187
- 177 Orchard St Unit 179
- 43 N Sharon St Unit 45
- 173 Orchard St
- 218 Freeborn Ave
- 172 Freeborn Ave Unit 174
- 47 N Sharon St
- 169 Orchard St Unit 171
- 205 Orchard St