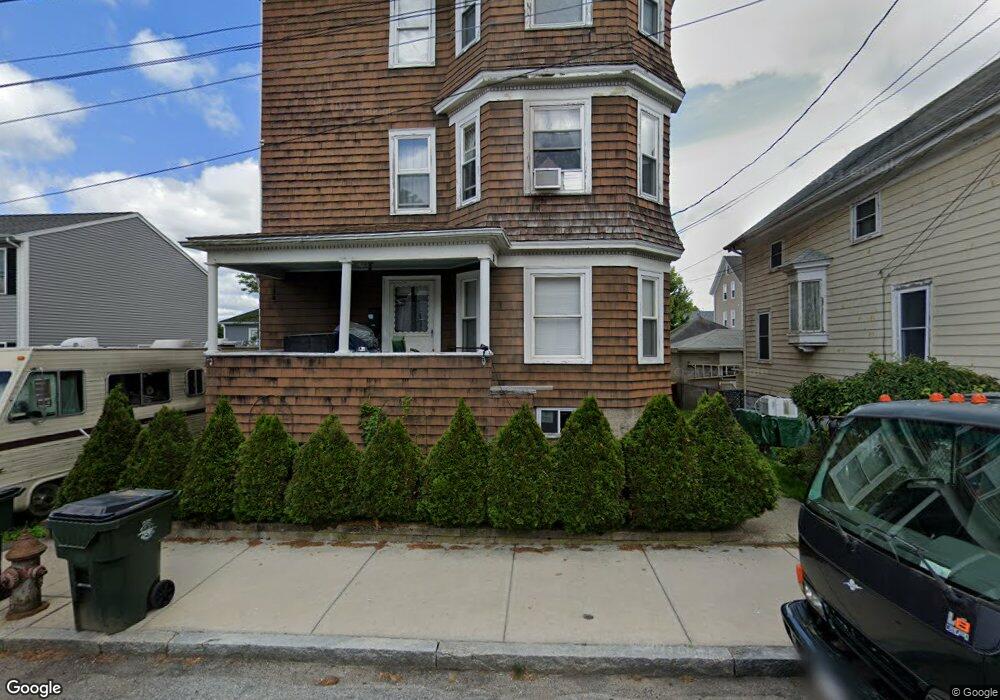
34 Nancy St Fall River, MA 02721
Niagara NeighborhoodEstimated Value: $539,323 - $762,000
9
Beds
3
Baths
3,552
Sq Ft
$176/Sq Ft
Est. Value
About This Home
This home is located at 34 Nancy St, Fall River, MA 02721 and is currently estimated at $624,831, approximately $175 per square foot. 34 Nancy St is a home located in Bristol County with nearby schools including William S Greene, Talbot Innovation School, and B M C Durfee High School.
Ownership History
Date
Name
Owned For
Owner Type
Purchase Details
Closed on
Aug 20, 2004
Sold by
Hopkins Jeffrey J
Bought by
Hopkins Jeffrey J and Hopkins Tracy M
Current Estimated Value
Home Financials for this Owner
Home Financials are based on the most recent Mortgage that was taken out on this home.
Original Mortgage
$223,920
Interest Rate
6.16%
Mortgage Type
Purchase Money Mortgage
Purchase Details
Closed on
Aug 13, 2004
Sold by
Raposa Cheryl and Raposa Mercias
Bought by
Trott Brendan C and Trott Danean M
Home Financials for this Owner
Home Financials are based on the most recent Mortgage that was taken out on this home.
Original Mortgage
$223,920
Interest Rate
6.16%
Mortgage Type
Purchase Money Mortgage
Purchase Details
Closed on
Aug 3, 2004
Sold by
Raposa Mercias
Bought by
Hopkins Jeffrey J
Home Financials for this Owner
Home Financials are based on the most recent Mortgage that was taken out on this home.
Original Mortgage
$223,920
Interest Rate
6.16%
Mortgage Type
Purchase Money Mortgage
Purchase Details
Closed on
Apr 1, 2004
Sold by
Raposa Cheryl and Raposa Mercias
Bought by
Raposa Mercias
Create a Home Valuation Report for This Property
The Home Valuation Report is an in-depth analysis detailing your home's value as well as a comparison with similar homes in the area
Home Values in the Area
Average Home Value in this Area
Purchase History
| Date | Buyer | Sale Price | Title Company |
|---|---|---|---|
| Hopkins Jeffrey J | -- | -- | |
| Trott Brendan C | $279,900 | -- | |
| Hopkins Jeffrey J | $275,000 | -- | |
| Raposa Mercias | -- | -- |
Source: Public Records
Mortgage History
| Date | Status | Borrower | Loan Amount |
|---|---|---|---|
| Open | Raposa Mercias | $203,920 | |
| Closed | Raposa Mercias | $223,920 | |
| Closed | Raposa Mercias | $220,000 | |
| Closed | Raposa Mercias | $55,000 |
Source: Public Records
Tax History
| Year | Tax Paid | Tax Assessment Tax Assessment Total Assessment is a certain percentage of the fair market value that is determined by local assessors to be the total taxable value of land and additions on the property. | Land | Improvement |
|---|---|---|---|---|
| 2025 | $4,950 | $432,300 | $107,100 | $325,200 |
| 2024 | $4,991 | $434,400 | $103,200 | $331,200 |
| 2023 | $4,444 | $362,200 | $85,300 | $276,900 |
| 2022 | $3,958 | $313,600 | $81,200 | $232,400 |
| 2021 | $3,751 | $271,200 | $77,200 | $194,000 |
| 2020 | $3,387 | $234,400 | $76,100 | $158,300 |
| 2019 | $2,903 | $199,100 | $73,300 | $125,800 |
| 2018 | $2,885 | $197,300 | $79,400 | $117,900 |
| 2017 | $2,710 | $193,600 | $75,700 | $117,900 |
| 2016 | $2,663 | $195,400 | $80,500 | $114,900 |
| 2015 | $2,557 | $195,500 | $80,500 | $115,000 |
| 2014 | $2,568 | $204,100 | $78,100 | $126,000 |
Source: Public Records
Map
Nearby Homes
Your Personal Tour Guide
Ask me questions while you tour the home.