34 NE Cove Rd Great Barrington, MA 01230
Estimated Value: $622,175 - $807,000
3
Beds
2
Baths
1,955
Sq Ft
$349/Sq Ft
Est. Value
About This Home
This home is located at 34 NE Cove Rd, Great Barrington, MA 01230 and is currently estimated at $681,794, approximately $348 per square foot. 34 NE Cove Rd is a home with nearby schools including Muddy Brook Regional Elementary School, W.E.B Du Bois Regional Middle School, and Monument Mountain Regional High School.
Ownership History
Date
Name
Owned For
Owner Type
Purchase Details
Closed on
Feb 29, 2024
Sold by
Cobb Christopher C and Cobb Susan E
Bought by
Cobb Trevor
Current Estimated Value
Purchase Details
Closed on
May 15, 1986
Bought by
Cobb Christopher C and Cobb Susan E
Create a Home Valuation Report for This Property
The Home Valuation Report is an in-depth analysis detailing your home's value as well as a comparison with similar homes in the area
Home Values in the Area
Average Home Value in this Area
Purchase History
| Date | Buyer | Sale Price | Title Company |
|---|---|---|---|
| Cobb Trevor | -- | None Available | |
| Cobb Trevor | -- | None Available | |
| Cobb Trevor | -- | None Available | |
| Cobb Christopher C | $120,000 | -- |
Source: Public Records
Mortgage History
| Date | Status | Borrower | Loan Amount |
|---|---|---|---|
| Previous Owner | Cobb Christopher C | $80,000 | |
| Previous Owner | Cobb Christopher C | $93,500 |
Source: Public Records
Tax History Compared to Growth
Tax History
| Year | Tax Paid | Tax Assessment Tax Assessment Total Assessment is a certain percentage of the fair market value that is determined by local assessors to be the total taxable value of land and additions on the property. | Land | Improvement |
|---|---|---|---|---|
| 2025 | $3,348 | $519,900 | $200,100 | $319,800 |
| 2024 | $3,187 | $519,900 | $200,100 | $319,800 |
| 2023 | $2,814 | $462,000 | $200,100 | $261,900 |
| 2022 | $3,059 | $420,200 | $200,100 | $220,100 |
| 2021 | $3,055 | $420,200 | $200,100 | $220,100 |
| 2020 | $3,122 | $420,200 | $200,100 | $220,100 |
| 2019 | $3,109 | $420,200 | $200,100 | $220,100 |
| 2018 | $3,146 | $426,300 | $221,900 | $204,400 |
| 2017 | $3,112 | $426,300 | $221,900 | $204,400 |
| 2016 | $2,614 | $418,300 | $221,900 | $196,400 |
| 2015 | $2,476 | $418,300 | $221,900 | $196,400 |
Source: Public Records
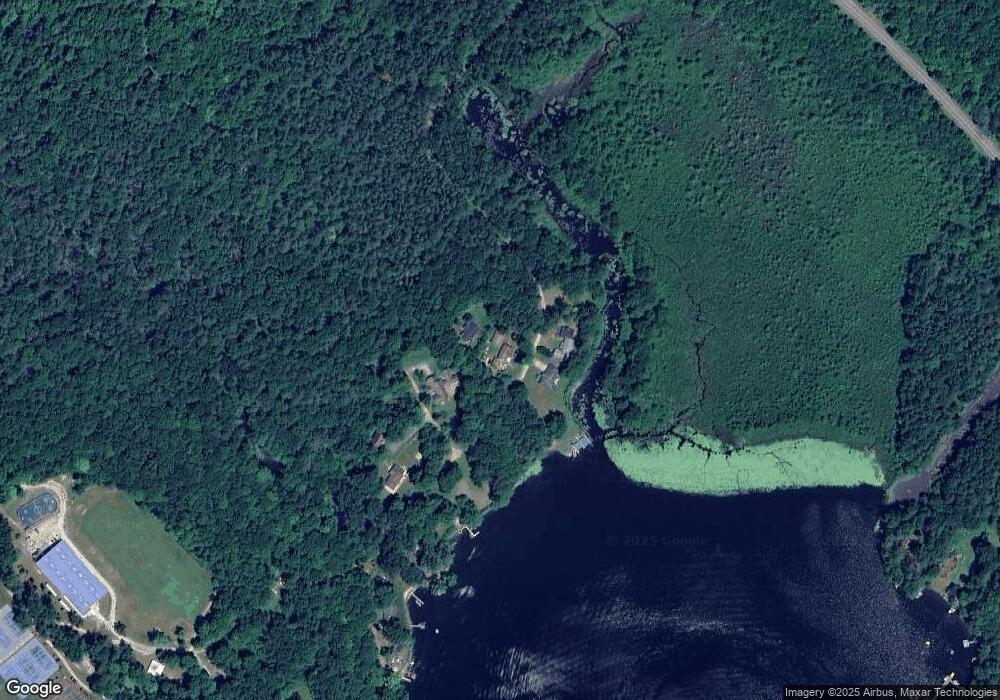
Map
Nearby Homes