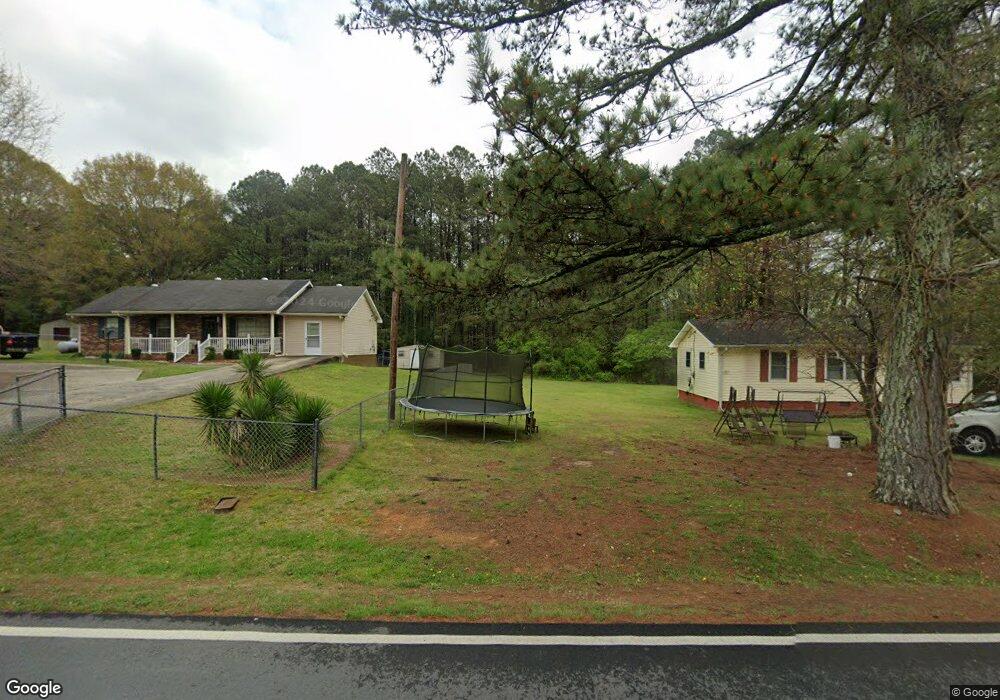
34 Pine Pitch Rd Cedartown, GA 30125
Estimated Value: $131,099 - $288,000
3
Beds
1
Bath
770
Sq Ft
$258/Sq Ft
Est. Value
About This Home
This home is located at 34 Pine Pitch Rd, Cedartown, GA 30125 and is currently estimated at $198,275, approximately $257 per square foot. 34 Pine Pitch Rd is a home located in Polk County with nearby schools including Vineyard Harvester Christian Academy.
Ownership History
Date
Name
Owned For
Owner Type
Purchase Details
Closed on
Feb 9, 1990
Sold by
Price Allen L
Bought by
Price Allen L
Current Estimated Value
Purchase Details
Closed on
May 5, 1989
Sold by
Crawford Danny D
Bought by
Price Allen L
Purchase Details
Closed on
Dec 9, 1987
Sold by
Smith Nellie Grace
Bought by
Crawford Danny D
Purchase Details
Closed on
Jun 18, 1987
Sold by
Elrod Jack and Elrod Jennie
Bought by
Smith Nellie Grace
Purchase Details
Closed on
Aug 8, 1984
Sold by
Hearne Rufus C
Bought by
Elrod Jack and Elrod Jennie
Purchase Details
Closed on
Oct 9, 1975
Sold by
Farmers Home Admin
Bought by
Hearne Rufus C
Purchase Details
Closed on
Jan 31, 1975
Sold by
Tucker John W
Bought by
Farmers Home Admin
Purchase Details
Closed on
Feb 19, 1974
Sold by
Hopkins John P
Bought by
Tucker John W
Purchase Details
Closed on
Nov 19, 1971
Sold by
Earley Tommy W
Bought by
Hopkins John P
Create a Home Valuation Report for This Property
The Home Valuation Report is an in-depth analysis detailing your home's value as well as a comparison with similar homes in the area
Home Values in the Area
Average Home Value in this Area
Purchase History
| Date | Buyer | Sale Price | Title Company |
|---|---|---|---|
| Price Allen L | -- | -- | |
| Price Allen L | $28,500 | -- | |
| Crawford Danny D | -- | -- | |
| Crawford Danny D | $26,500 | -- | |
| Smith Nellie Grace | -- | -- | |
| Elrod Jack | -- | -- | |
| Hearne Rufus C | -- | -- | |
| Farmers Home Admin | -- | -- | |
| Tucker John W | -- | -- | |
| Hopkins John P | -- | -- |
Source: Public Records
Tax History Compared to Growth
Tax History
| Year | Tax Paid | Tax Assessment Tax Assessment Total Assessment is a certain percentage of the fair market value that is determined by local assessors to be the total taxable value of land and additions on the property. | Land | Improvement |
|---|---|---|---|---|
| 2024 | $679 | $34,498 | $1,518 | $32,980 |
| 2023 | $485 | $22,441 | $1,518 | $20,923 |
| 2022 | $401 | $18,914 | $1,012 | $17,902 |
| 2021 | $407 | $18,914 | $1,012 | $17,902 |
| 2020 | $407 | $18,914 | $1,012 | $17,902 |
| 2019 | $237 | $10,837 | $1,012 | $9,825 |
| 2018 | $235 | $10,524 | $1,012 | $9,512 |
| 2017 | $232 | $10,524 | $1,012 | $9,512 |
| 2016 | $236 | $10,683 | $1,171 | $9,512 |
| 2015 | $241 | $10,820 | $1,171 | $9,649 |
| 2014 | $243 | $10,820 | $1,171 | $9,649 |
Source: Public Records
Map
Nearby Homes
- 1522 Collard Valley Rd
- 387 Lindsey Chapel Rd
- 256 Cuzzort Rd
- 0 Blanche Rd Unit 10609468
- 0 Blanche Rd Unit 7652978
- 2705 Collard Valley Rd
- 200 Kelly Rd
- 660 Valley Rd
- 12 Breckenridge Dr
- 645 Valley Rd
- 662 Hillside Dr
- 618 Valley Rd
- 462 Oakwood Dr
- 0 Rome Hwy Unit 10521649
- 77 Ben Dr W
- 362 Oakwood Dr
- 94 Wimberly Hill Loop
- 0 Richard Pullen Rd Unit 10577442
- 0 Richard Pullen Rd Unit 7626794
- 292 Kimwood Dr
- 44 Pine Pitch Rd
- 54 Pine Pitch Rd
- 1753 Collard Valley Rd
- 84 Pine Pitch Rd
- 1707 Collard Valley Rd
- 1691 Collard Valley Rd
- 1702 Collard Valley Rd
- 1673 Collard Valley Rd
- 669 Lindsey Chapel Rd
- 1674 Collard Valley Rd
- 1632 Collard Valley Rd
- 160 Pine Pitch Rd
- 1655 Collard Valley Rd
- 635 Lindsey Chapel Rd
- 1841 Collard Valley Rd
- 1614 Collard Valley Rd
- 1625 Collard Valley Rd
- 621 Lindsey Chapel Rd
- 165 Pine Pitch Rd
- 1596 Collard Valley Rd