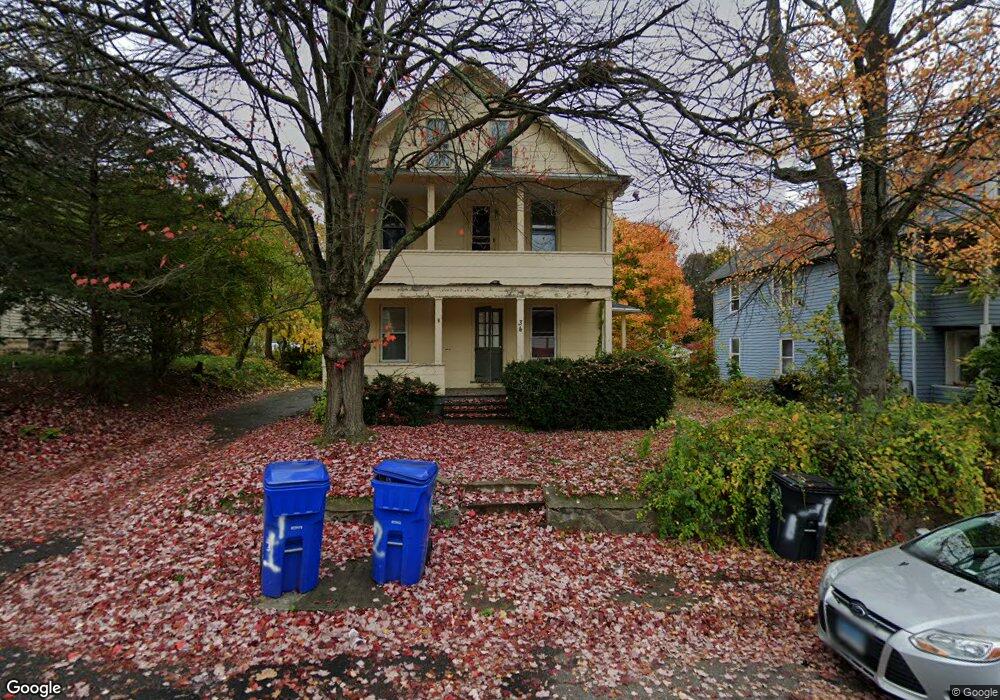
34 Pine St Torrington, CT 06790
Estimated Value: $261,108 - $307,000
3
Beds
1
Bath
1,924
Sq Ft
$150/Sq Ft
Est. Value
About This Home
This home is located at 34 Pine St, Torrington, CT 06790 and is currently estimated at $288,027, approximately $149 per square foot. 34 Pine St is a home located in Litchfield County with nearby schools including Torrington Middle School, Torrington High School, and St. John Paul the Great Academy.
Ownership History
Date
Name
Owned For
Owner Type
Purchase Details
Closed on
Dec 10, 2015
Sold by
Union Sb
Bought by
Penaranda Jesus
Current Estimated Value
Home Financials for this Owner
Home Financials are based on the most recent Mortgage that was taken out on this home.
Original Mortgage
$59,315
Outstanding Balance
$1,771
Interest Rate
3.77%
Mortgage Type
Commercial
Estimated Equity
$286,256
Purchase Details
Closed on
Apr 29, 2015
Sold by
Grondin Gilles M
Bought by
Union Sb
Purchase Details
Closed on
Feb 6, 2007
Sold by
Tharau Scott
Bought by
Grondin Gilles M
Home Financials for this Owner
Home Financials are based on the most recent Mortgage that was taken out on this home.
Original Mortgage
$134,900
Interest Rate
6.16%
Purchase Details
Closed on
Dec 17, 2002
Sold by
Litke Doris
Bought by
Tharau Scott
Home Financials for this Owner
Home Financials are based on the most recent Mortgage that was taken out on this home.
Original Mortgage
$48,900
Interest Rate
6.17%
Create a Home Valuation Report for This Property
The Home Valuation Report is an in-depth analysis detailing your home's value as well as a comparison with similar homes in the area
Home Values in the Area
Average Home Value in this Area
Purchase History
| Date | Buyer | Sale Price | Title Company |
|---|---|---|---|
| Penaranda Jesus | $67,282 | -- | |
| Union Sb | -- | -- | |
| Grondin Gilles M | $150,000 | -- | |
| Tharau Scott | $51,500 | -- |
Source: Public Records
Mortgage History
| Date | Status | Borrower | Loan Amount |
|---|---|---|---|
| Open | Tharau Scott | $59,315 | |
| Previous Owner | Tharau Scott | $134,900 | |
| Previous Owner | Tharau Scott | $65,000 | |
| Previous Owner | Tharau Scott | $48,900 |
Source: Public Records
Tax History
| Year | Tax Paid | Tax Assessment Tax Assessment Total Assessment is a certain percentage of the fair market value that is determined by local assessors to be the total taxable value of land and additions on the property. | Land | Improvement |
|---|---|---|---|---|
| 2025 | $6,500 | $169,050 | $20,370 | $148,680 |
| 2024 | $3,676 | $76,630 | $20,370 | $56,260 |
| 2023 | $3,675 | $76,630 | $20,370 | $56,260 |
| 2022 | $3,612 | $76,630 | $20,370 | $56,260 |
| 2021 | $3,538 | $76,630 | $20,370 | $56,260 |
| 2020 | $3,538 | $76,630 | $20,370 | $56,260 |
| 2019 | $3,189 | $69,070 | $20,370 | $48,700 |
| 2018 | $3,189 | $69,070 | $20,370 | $48,700 |
| 2017 | $3,160 | $69,070 | $20,370 | $48,700 |
| 2016 | $3,160 | $69,070 | $20,370 | $48,700 |
| 2015 | $3,160 | $69,070 | $20,370 | $48,700 |
| 2014 | -- | $100,260 | $27,720 | $72,540 |
Source: Public Records
Map
Nearby Homes
- 243 N Elm St
- 0 Red Mountain Ave
- 368 Migeon Ave
- 130 N Elm St
- 682 Main St
- 839 Main St Unit 56
- 839 Main St Unit 98
- 839 Main St Unit 78
- 839 Main St Unit 104
- 23 Benham St
- 42 Pulver St
- 0 Stoneridge Dr
- 118 Migeon Ave
- 00 Winthrop St & E Elm St
- 118 Pearl St
- 408 Main St
- 444 Prospect St
- 329 Church St
- 00 Church St
- 80 Washington Ave
- 34 Pine St
- 34 Pine St
- 34 Pine St
- 26 Pine St
- 26 Pine St Unit 2
- 26 Pine St Unit 2
- 26 Pine St Unit 1
- 42 Pine St
- 31 Pine St
- 31 Pine St Unit U1
- 31 Pine St Unit U2
- 52 Pine St
- 35 Pine St Unit 2nd Floor
- 16 Pine St Unit 2
- 16 Pine St
- 39 Pine St Unit 1st F
- 39 Pine St 1st Fl
- 39 Pine St 1st Floor
- 39 Pine St
- 41 Pine St
Your Personal Tour Guide
Ask me questions while you tour the home.