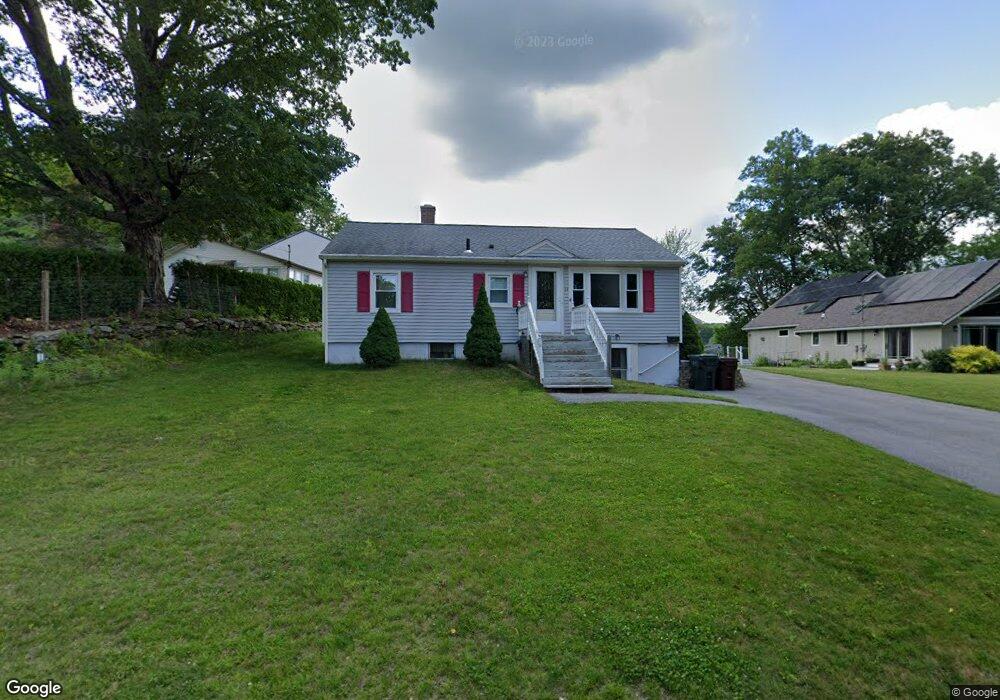
34 Pollier Way Auburn, MA 01501
Stoneville NeighborhoodEstimated Value: $349,000 - $466,000
3
Beds
2
Baths
936
Sq Ft
$445/Sq Ft
Est. Value
About This Home
This home is located at 34 Pollier Way, Auburn, MA 01501 and is currently estimated at $416,232, approximately $444 per square foot. 34 Pollier Way is a home located in Worcester County with nearby schools including Auburn Senior High School and Shrewsbury Montessori School - Auburn Campus.
Ownership History
Date
Name
Owned For
Owner Type
Purchase Details
Closed on
Jan 29, 2004
Sold by
Pollier James E and Pollier Liona M
Bought by
Couture Reny A and Couture Sean A
Current Estimated Value
Home Financials for this Owner
Home Financials are based on the most recent Mortgage that was taken out on this home.
Original Mortgage
$163,000
Outstanding Balance
$76,393
Interest Rate
5.82%
Mortgage Type
Purchase Money Mortgage
Estimated Equity
$339,839
Create a Home Valuation Report for This Property
The Home Valuation Report is an in-depth analysis detailing your home's value as well as a comparison with similar homes in the area
Home Values in the Area
Average Home Value in this Area
Purchase History
| Date | Buyer | Sale Price | Title Company |
|---|---|---|---|
| Couture Reny A | $190,000 | -- |
Source: Public Records
Mortgage History
| Date | Status | Borrower | Loan Amount |
|---|---|---|---|
| Open | Couture Reny A | $163,000 |
Source: Public Records
Tax History Compared to Growth
Tax History
| Year | Tax Paid | Tax Assessment Tax Assessment Total Assessment is a certain percentage of the fair market value that is determined by local assessors to be the total taxable value of land and additions on the property. | Land | Improvement |
|---|---|---|---|---|
| 2025 | $55 | $387,300 | $176,100 | $211,200 |
| 2024 | $5,388 | $360,900 | $169,500 | $191,400 |
| 2023 | $5,166 | $325,300 | $152,100 | $173,200 |
| 2022 | $4,972 | $295,600 | $152,100 | $143,500 |
| 2021 | $4,653 | $256,500 | $134,400 | $122,100 |
| 2020 | $4,612 | $256,500 | $134,400 | $122,100 |
| 2019 | $4,526 | $245,700 | $135,000 | $110,700 |
| 2018 | $4,193 | $227,400 | $126,200 | $101,200 |
| 2017 | $3,956 | $215,700 | $114,500 | $101,200 |
| 2016 | $3,781 | $209,000 | $118,100 | $90,900 |
| 2015 | $3,521 | $204,000 | $118,100 | $85,900 |
| 2014 | $3,330 | $192,600 | $112,400 | $80,200 |
Source: Public Records
Map
Nearby Homes