Estimated Value: $418,816 - $499,000
2
Beds
--
Bath
1,292
Sq Ft
$346/Sq Ft
Est. Value
About This Home
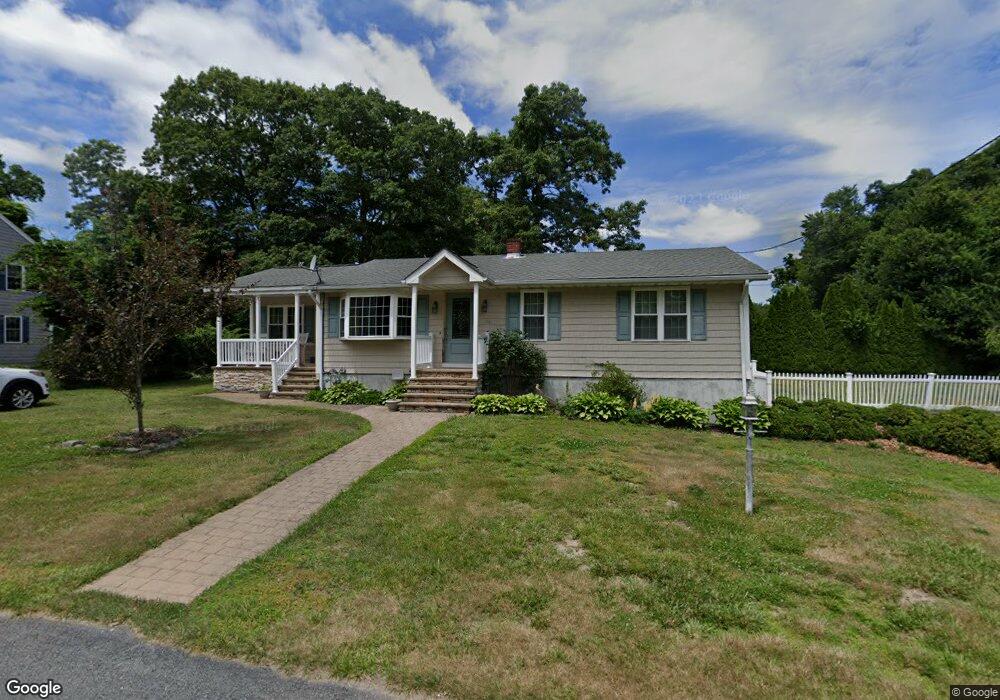
This home is located at 34 R Dr, Westport, MA 02790 and is currently estimated at $446,454, approximately $345 per square foot. 34 R Dr is a home located in Bristol County with nearby schools including Alice A. Macomber Primary School, Westport Elementary School, and Westport Middle-High School.
Ownership History
Date
Name
Owned For
Owner Type
Purchase Details
Closed on
Oct 29, 1999
Sold by
Paiva Michael A and Ribeiro Margaret A
Bought by
Pavao Paul
Current Estimated Value
Home Financials for this Owner
Home Financials are based on the most recent Mortgage that was taken out on this home.
Original Mortgage
$86,000
Interest Rate
7.78%
Mortgage Type
Purchase Money Mortgage
Create a Home Valuation Report for This Property
The Home Valuation Report is an in-depth analysis detailing your home's value as well as a comparison with similar homes in the area
Home Values in the Area
Average Home Value in this Area
Purchase History
| Date | Buyer | Sale Price | Title Company |
|---|---|---|---|
| Pavao Paul | $110,000 | -- |
Source: Public Records
Mortgage History
| Date | Status | Borrower | Loan Amount |
|---|---|---|---|
| Open | Pavao Paul | $263,000 | |
| Closed | Pavao Paul | $220,000 | |
| Closed | Pavao Paul | $86,000 |
Source: Public Records
Tax History Compared to Growth
Tax History
| Year | Tax Paid | Tax Assessment Tax Assessment Total Assessment is a certain percentage of the fair market value that is determined by local assessors to be the total taxable value of land and additions on the property. | Land | Improvement |
|---|---|---|---|---|
| 2025 | $2,532 | $339,800 | $159,500 | $180,300 |
| 2024 | $2,518 | $325,700 | $147,800 | $177,900 |
| 2023 | $2,419 | $296,500 | $134,600 | $161,900 |
| 2022 | $2,147 | $260,200 | $122,400 | $137,800 |
| 2021 | $2,147 | $249,100 | $111,300 | $137,800 |
| 2020 | $2,062 | $244,600 | $106,800 | $137,800 |
| 2019 | $2,020 | $244,200 | $106,800 | $137,400 |
| 2018 | $1,877 | $229,700 | $108,000 | $121,700 |
| 2017 | $1,784 | $223,800 | $104,500 | $119,300 |
| 2016 | $1,657 | $209,500 | $101,100 | $108,400 |
| 2015 | $1,587 | $200,100 | $103,400 | $96,700 |
Source: Public Records
Map
Nearby Homes