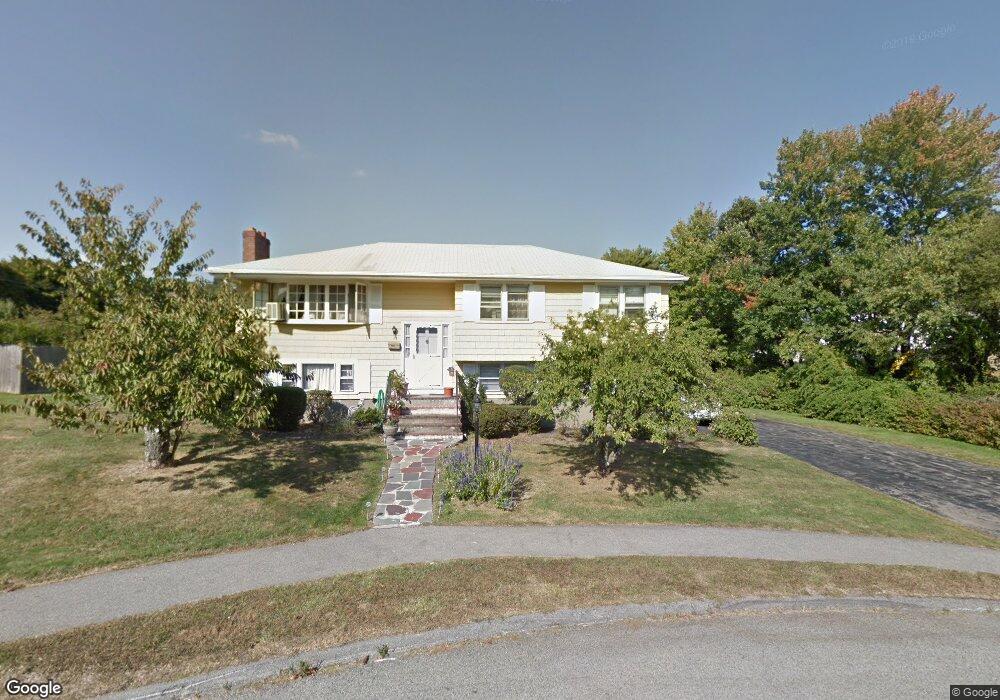
34 Rogers Cir Braintree, MA 02184
East Braintree NeighborhoodEstimated Value: $716,173 - $742,000
3
Beds
2
Baths
1,700
Sq Ft
$431/Sq Ft
Est. Value
About This Home
This home is located at 34 Rogers Cir, Braintree, MA 02184 and is currently estimated at $732,043, approximately $430 per square foot. 34 Rogers Cir is a home located in Norfolk County with nearby schools including Braintree High School, Meeting House Montessori School, and Sacred Heart Elementary School.
Ownership History
Date
Name
Owned For
Owner Type
Purchase Details
Closed on
May 8, 2009
Sold by
Sharifi Ali A
Bought by
Sharifi Ft
Current Estimated Value
Purchase Details
Closed on
Aug 20, 1999
Sold by
Ventresca John and Ventresca Mafalda M
Bought by
Sharifi Ali A
Home Financials for this Owner
Home Financials are based on the most recent Mortgage that was taken out on this home.
Original Mortgage
$141,000
Interest Rate
7.6%
Mortgage Type
Purchase Money Mortgage
Create a Home Valuation Report for This Property
The Home Valuation Report is an in-depth analysis detailing your home's value as well as a comparison with similar homes in the area
Home Values in the Area
Average Home Value in this Area
Purchase History
| Date | Buyer | Sale Price | Title Company |
|---|---|---|---|
| Sharifi Ft | -- | -- | |
| Sharifi Ali A | $245,000 | -- |
Source: Public Records
Mortgage History
| Date | Status | Borrower | Loan Amount |
|---|---|---|---|
| Previous Owner | Sharifi Ali A | $141,000 |
Source: Public Records
Tax History Compared to Growth
Tax History
| Year | Tax Paid | Tax Assessment Tax Assessment Total Assessment is a certain percentage of the fair market value that is determined by local assessors to be the total taxable value of land and additions on the property. | Land | Improvement |
|---|---|---|---|---|
| 2025 | $6,556 | $656,900 | $387,200 | $269,700 |
| 2024 | $5,846 | $616,700 | $356,700 | $260,000 |
| 2023 | $5,570 | $570,700 | $326,100 | $244,600 |
| 2022 | $5,273 | $529,900 | $285,300 | $244,600 |
| 2021 | $4,922 | $494,700 | $257,800 | $236,900 |
| 2020 | $4,647 | $471,300 | $234,400 | $236,900 |
| 2019 | $4,551 | $451,000 | $234,400 | $216,600 |
| 2018 | $4,332 | $411,000 | $203,800 | $207,200 |
| 2017 | $4,186 | $389,800 | $193,600 | $196,200 |
| 2016 | $4,098 | $373,200 | $183,400 | $189,800 |
| 2015 | $4,069 | $367,600 | $179,400 | $188,200 |
| 2014 | $3,692 | $323,300 | $155,900 | $167,400 |
Source: Public Records
Map
Nearby Homes
- 11 Rogers Cir
- 23 Bower Rd
- 25 John Paul Cir
- 1 Pantano St
- 54 Elmlawn Rd
- 39 Morrison Rd
- 106 Home Park Rd
- 102 Conrad St
- 39 Dobson Rd
- 161 Cedar St
- 52 Norman Rd
- 10 Hughes St
- 391 Commercial St
- 31 Tingley Rd
- 37 Skyline Dr Unit 11
- 171 Hayward St
- 25 W Howard St Unit D2
- 205 River St
- 141 Hobart St
- 15 Bower Rd Unit B2
- 24 Rogers Cir
- 650 Commercial St
- 648 Commercial St
- 44 Rogers Cir
- 22 Rogers Cir
- 642 Commercial St
- 652 Commercial St
- 20 Rogers Cir
- 14 Rogers Cir Unit 14
- 35 Rogers Cir
- 16 Rogers Cir
- 25 Rogers Cir
- 636 Commercial St
- 17 Rogers Cir
- 10 Rogers Cir
- 115 Bower Rd
- 8 Rogers Cir
- 665 Commercial St
- 6 Rogers Cir
- 647 Commercial St