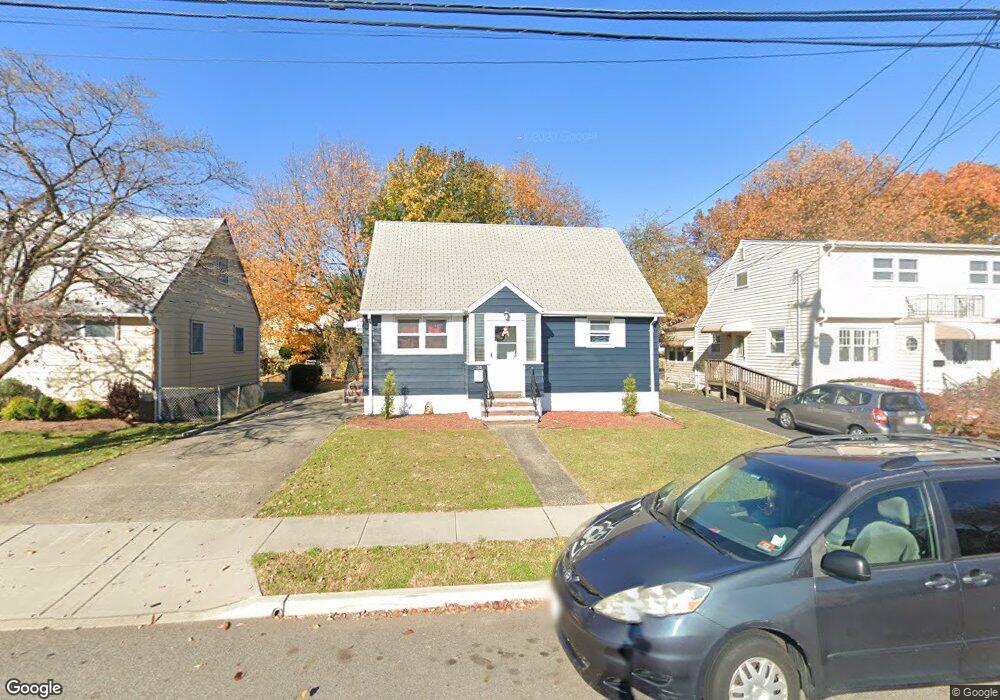
34 Runyon Rd Clifton, NJ 07013
Richfield NeighborhoodEstimated Value: $514,000 - $593,000
3
Beds
1
Bath
780
Sq Ft
$706/Sq Ft
Est. Value
About This Home
This home is located at 34 Runyon Rd, Clifton, NJ 07013 and is currently estimated at $550,594, approximately $705 per square foot. 34 Runyon Rd is a home located in Passaic County with nearby schools including Clifton High School, St Andrew Elementary School, and New Hope School.
Ownership History
Date
Name
Owned For
Owner Type
Purchase Details
Closed on
Jul 2, 2020
Sold by
R O I Holdings Llc
Bought by
Madera Jairo
Current Estimated Value
Home Financials for this Owner
Home Financials are based on the most recent Mortgage that was taken out on this home.
Original Mortgage
$362,316
Outstanding Balance
$321,278
Interest Rate
3.1%
Estimated Equity
$229,316
Purchase Details
Closed on
Apr 1, 2019
Sold by
Berdnik Richard H
Bought by
R O I Holdings Llc
Purchase Details
Closed on
Jul 10, 2003
Sold by
Maixner Dennis
Bought by
Maixner Dennis
Create a Home Valuation Report for This Property
The Home Valuation Report is an in-depth analysis detailing your home's value as well as a comparison with similar homes in the area
Home Values in the Area
Average Home Value in this Area
Purchase History
| Date | Buyer | Sale Price | Title Company |
|---|---|---|---|
| Madera Jairo | $369,000 | Title Agency Of Nj Inc | |
| R O I Holdings Llc | $219,000 | Title Agency Of Nj Inc | |
| Maixner Dennis | -- | -- |
Source: Public Records
Mortgage History
| Date | Status | Borrower | Loan Amount |
|---|---|---|---|
| Open | Madera Jairo | $362,316 |
Source: Public Records
Tax History Compared to Growth
Tax History
| Year | Tax Paid | Tax Assessment Tax Assessment Total Assessment is a certain percentage of the fair market value that is determined by local assessors to be the total taxable value of land and additions on the property. | Land | Improvement |
|---|---|---|---|---|
| 2025 | $8,791 | $148,100 | $92,500 | $55,600 |
| 2024 | $8,581 | $148,100 | $92,500 | $55,600 |
| 2022 | $8,457 | $148,100 | $92,500 | $55,600 |
| 2021 | $8,108 | $148,100 | $92,500 | $55,600 |
| 2020 | $7,470 | $136,000 | $92,500 | $43,500 |
| 2019 | $7,417 | $136,000 | $92,500 | $43,500 |
| 2018 | $7,375 | $136,000 | $92,500 | $43,500 |
| 2017 | $7,295 | $136,000 | $92,500 | $43,500 |
| 2016 | $6,904 | $136,000 | $92,500 | $43,500 |
| 2015 | $6,834 | $136,000 | $92,500 | $43,500 |
| 2014 | $6,689 | $136,000 | $92,500 | $43,500 |
Source: Public Records
Map
Nearby Homes