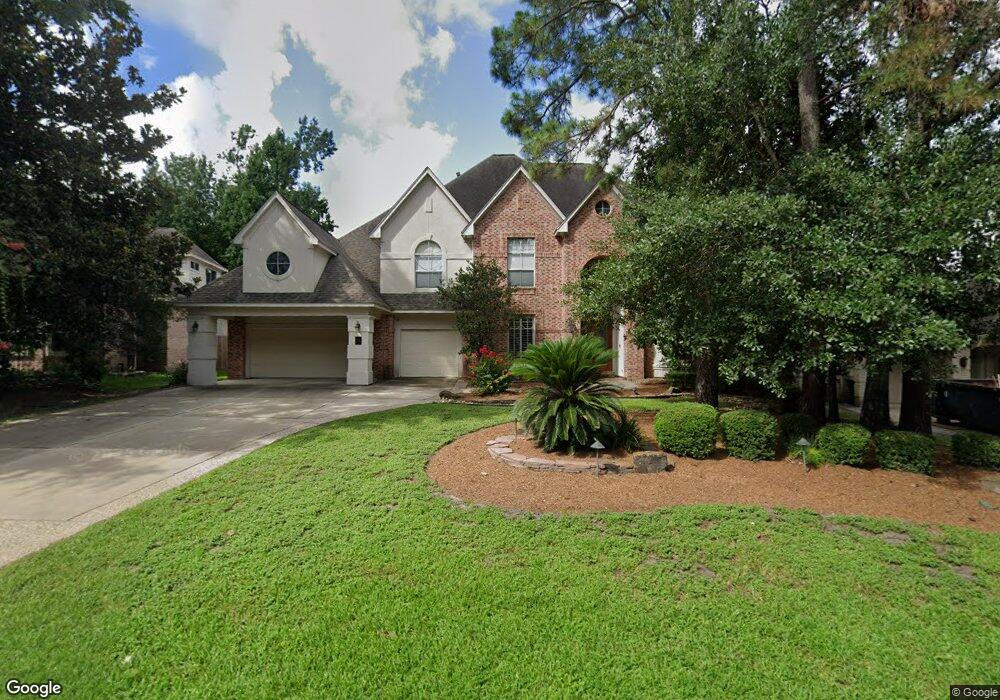
34 S Spring Trellis Cir Spring, TX 77382
Indian Springs NeighborhoodEstimated Value: $984,000 - $1,102,000
Studio
5
Baths
4,346
Sq Ft
$237/Sq Ft
Est. Value
About This Home
This home is located at 34 S Spring Trellis Cir, Spring, TX 77382 and is currently estimated at $1,031,964, approximately $237 per square foot. 34 S Spring Trellis Cir is a home located in Montgomery County with nearby schools including Galatas Elementary School, Mitchell Intermediate School, and McCullough Junior High School.
Ownership History
Date
Name
Owned For
Owner Type
Purchase Details
Closed on
Mar 24, 2005
Sold by
Sala Rafael V and Sala Rosario
Bought by
Fayaz Imran and Fayaz Ayesha S
Current Estimated Value
Home Financials for this Owner
Home Financials are based on the most recent Mortgage that was taken out on this home.
Original Mortgage
$550,000
Interest Rate
5.71%
Mortgage Type
Purchase Money Mortgage
Purchase Details
Closed on
May 31, 2001
Sold by
Meadowlark Homes Inc
Bought by
Sala Rafael and Sala Rosario
Home Financials for this Owner
Home Financials are based on the most recent Mortgage that was taken out on this home.
Original Mortgage
$400,000
Interest Rate
7.07%
Purchase Details
Closed on
May 23, 2000
Sold by
The Woodlands Land Development
Bought by
Fayaz Imran and Fayaz Ayesha S
Create a Home Valuation Report for This Property
The Home Valuation Report is an in-depth analysis detailing your home's value as well as a comparison with similar homes in the area
Home Values in the Area
Average Home Value in this Area
Purchase History
| Date | Buyer | Sale Price | Title Company |
|---|---|---|---|
| Fayaz Imran | -- | Fidelity National Title | |
| Sala Rafael | -- | Stewart Title | |
| Fayaz Imran | -- | -- |
Source: Public Records
Mortgage History
| Date | Status | Borrower | Loan Amount |
|---|---|---|---|
| Closed | Fayaz Imran | $550,000 | |
| Previous Owner | Sala Rafael | $400,000 | |
| Closed | Sala Rafael | $50,000 |
Source: Public Records
Tax History
| Year | Tax Paid | Tax Assessment Tax Assessment Total Assessment is a certain percentage of the fair market value that is determined by local assessors to be the total taxable value of land and additions on the property. | Land | Improvement |
|---|---|---|---|---|
| 2025 | $14,092 | $890,762 | $140,000 | $750,762 |
| 2024 | $13,570 | $903,197 | $140,000 | $763,197 |
| 2023 | $13,570 | $865,180 | $140,000 | $797,250 |
| 2022 | $15,627 | $786,530 | $140,000 | $674,410 |
| 2021 | $15,244 | $715,030 | $57,850 | $657,180 |
| 2020 | $16,288 | $729,360 | $57,850 | $671,510 |
| 2019 | $15,340 | $665,000 | $57,850 | $607,150 |
| 2018 | $15,992 | $752,640 | $57,850 | $694,790 |
| 2017 | $18,472 | $790,750 | $57,850 | $732,900 |
| 2016 | $18,838 | $806,420 | $57,850 | $748,570 |
| 2015 | $16,372 | $764,350 | $57,850 | $713,520 |
| 2014 | $16,372 | $694,860 | $57,850 | $666,800 |
Source: Public Records
Map
Nearby Homes
- 31 Lenox Hill Ct
- 182 N Hazelcrest Cir
- 26 Squire Creek Way
- 71 Ivory Moon Place
- 87 S Copper Sage Cir
- 14 Mystic Pines Ct
- 6607 Lake Woodlands Dr Unit 223
- 6607 Lake Woodlands Dr Unit 312
- 59 Douvaine Ct
- 7 Stanwick Place
- 27 Silver Maple Place
- 7 N Spring Brook Ct
- 87 Mediterra Way
- 6 Douvaine Ct
- 75 Mediterra Way
- 82 S Warbler Bend Cir
- 112 Sundown Ridge Place
- 2 N Chantsong Cir
- 143 Hansom Trail St
- 78 Angelique Way
- 38 S Spring Trellis Cir
- 30 S Spring Trellis Cir
- 22 Julian Woods Place
- 18 Julian Woods Place
- 26 Julian Woods Place
- 42 S Spring Trellis Cir
- 42 Trellis Ct
- 14 Julian Woods Place
- 78 Lenox Hill Dr
- 43 Trellis Ct
- 43 S Spring Trellis Cir
- 10 Julian Woods Place
- 46 Trellis Ct
- 46 S Spring Trellis Cir
- 82 Lenox Hill Dr
- 67 Lenox Hill Dr
- 75 Lenox Hill Dr
- 47 N Spring Trellis Cir
- 47 S Spring Trellis Cir
- 63 Lenox Hill Dr
Your Personal Tour Guide
Ask me questions while you tour the home.