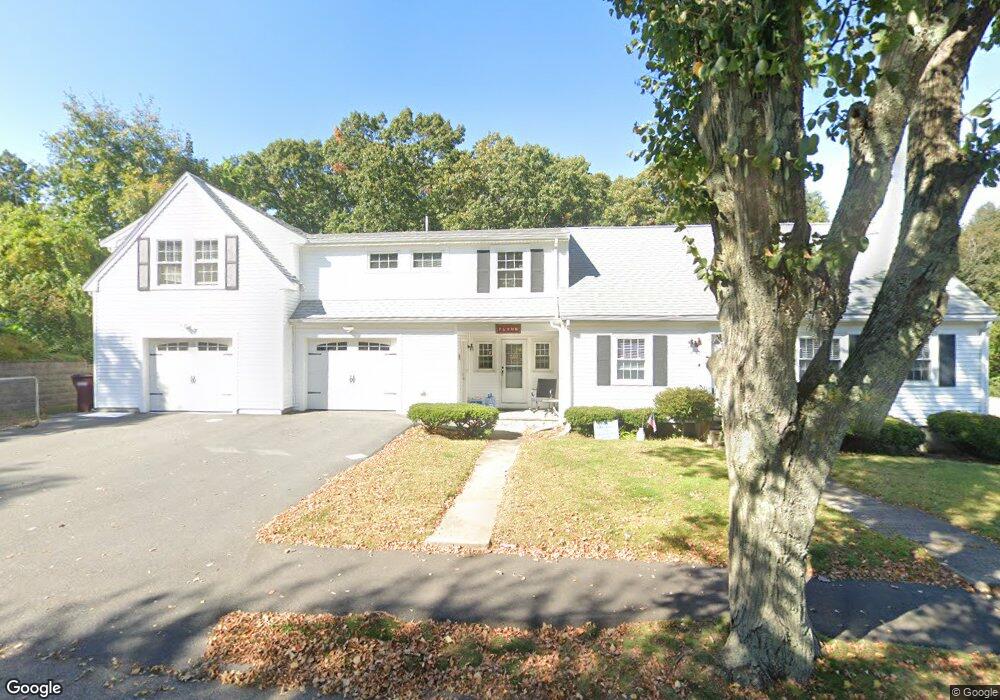
34 Savin St Dedham, MA 02026
The Manor NeighborhoodEstimated Value: $928,000 - $1,043,000
3
Beds
2
Baths
2,599
Sq Ft
$371/Sq Ft
Est. Value
About This Home
This home is located at 34 Savin St, Dedham, MA 02026 and is currently estimated at $965,279, approximately $371 per square foot. 34 Savin St is a home located in Norfolk County with nearby schools including Greenlodge Elementary School, Dedham Middle School, and Dedham High School.
Ownership History
Date
Name
Owned For
Owner Type
Purchase Details
Closed on
Jul 27, 2017
Sold by
Flynn Dianne
Bought by
Flynn David and Flynn Ann M
Current Estimated Value
Home Financials for this Owner
Home Financials are based on the most recent Mortgage that was taken out on this home.
Original Mortgage
$381,760
Outstanding Balance
$314,262
Interest Rate
3.91%
Mortgage Type
New Conventional
Estimated Equity
$651,017
Purchase Details
Closed on
May 30, 1984
Bought by
Flynn Charles J and Flynn Diane
Create a Home Valuation Report for This Property
The Home Valuation Report is an in-depth analysis detailing your home's value as well as a comparison with similar homes in the area
Home Values in the Area
Average Home Value in this Area
Purchase History
| Date | Buyer | Sale Price | Title Company |
|---|---|---|---|
| Flynn David | $610,000 | -- | |
| Flynn Charles J | -- | -- |
Source: Public Records
Mortgage History
| Date | Status | Borrower | Loan Amount |
|---|---|---|---|
| Open | Flynn David | $381,760 | |
| Previous Owner | Flynn Charles J | $95,000 | |
| Previous Owner | Flynn Charles J | $51,000 |
Source: Public Records
Tax History
| Year | Tax Paid | Tax Assessment Tax Assessment Total Assessment is a certain percentage of the fair market value that is determined by local assessors to be the total taxable value of land and additions on the property. | Land | Improvement |
|---|---|---|---|---|
| 2025 | $11,055 | $876,000 | $354,800 | $521,200 |
| 2024 | $11,078 | $886,200 | $321,900 | $564,300 |
| 2023 | $10,467 | $815,200 | $291,400 | $523,800 |
| 2022 | $9,740 | $729,600 | $273,600 | $456,000 |
| 2021 | $8,791 | $643,100 | $253,400 | $389,700 |
| 2020 | $8,796 | $641,100 | $253,400 | $387,700 |
| 2019 | $8,223 | $581,100 | $220,300 | $360,800 |
| 2018 | $7,895 | $542,600 | $192,300 | $350,300 |
| 2017 | $6,142 | $416,100 | $180,300 | $235,800 |
| 2016 | $5,987 | $386,500 | $166,800 | $219,700 |
| 2015 | $5,732 | $361,200 | $165,300 | $195,900 |
| 2014 | $5,832 | $362,700 | $162,300 | $200,400 |
Source: Public Records
Map
Nearby Homes
- 72 Crane St
- 68 Reed St
- 93 Alden St
- 50 Sprague St
- 12 Blossom St
- 105 Oakdale Ave
- 22 Azalea Cir
- 391 Sprague St
- 213 River St
- 397 Sprague St
- 18 Greensboro Rd
- 59 Hamilton Ave
- 51 Lancaster Rd
- 2 Leominster Rd
- 989 East St Unit 402
- 13 W Milton Place
- 1905 River St Unit 1905
- 1896 River St
- 1892 River St
- 22 N Stone Mill Dr Unit 1111
Your Personal Tour Guide
Ask me questions while you tour the home.