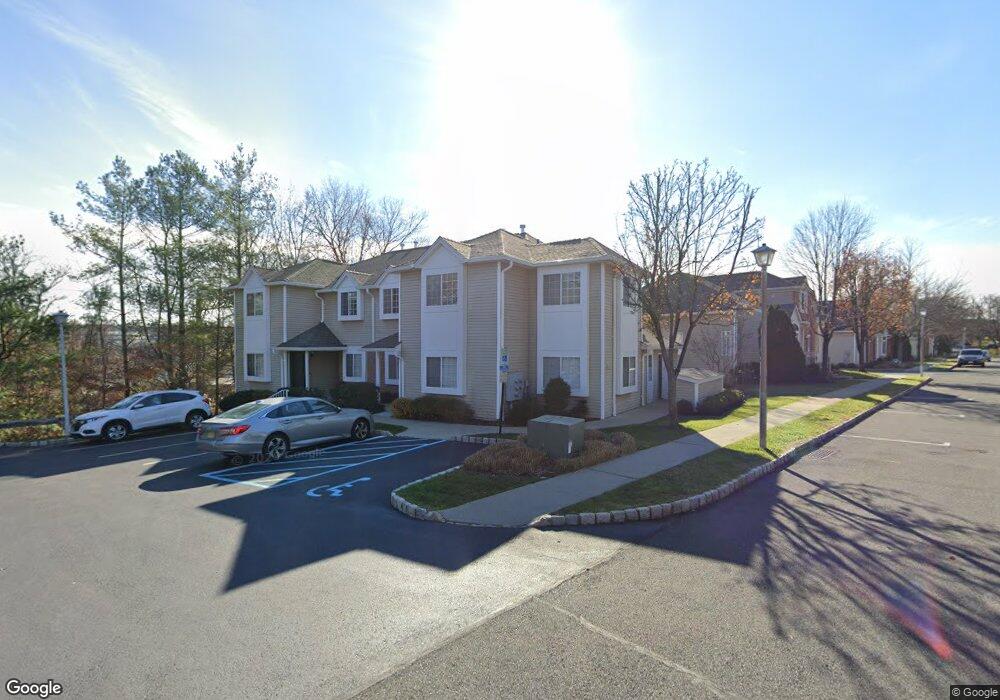
34 Schindler Ct Unit ML1 Chatham, NJ 07928
Estimated Value: $341,000 - $592,000
--
Bed
--
Bath
1,023
Sq Ft
$453/Sq Ft
Est. Value
About This Home
This home is located at 34 Schindler Ct Unit ML1, Chatham, NJ 07928 and is currently estimated at $463,345, approximately $452 per square foot. 34 Schindler Ct Unit ML1 is a home located in Morris County with nearby schools including Chatham High School, St. Patrick School, and ECLC of New Jersey.
Ownership History
Date
Name
Owned For
Owner Type
Purchase Details
Closed on
Aug 22, 2017
Sold by
Moody Karl Sharon and Moody Sharon
Bought by
Mensah Natalie
Current Estimated Value
Home Financials for this Owner
Home Financials are based on the most recent Mortgage that was taken out on this home.
Original Mortgage
$191,090
Outstanding Balance
$159,321
Interest Rate
3.93%
Mortgage Type
New Conventional
Estimated Equity
$304,024
Purchase Details
Closed on
Jul 21, 2000
Sold by
Conwell Mark and Conwell Ann
Bought by
Moody Sharon S
Home Financials for this Owner
Home Financials are based on the most recent Mortgage that was taken out on this home.
Original Mortgage
$103,000
Interest Rate
8.18%
Purchase Details
Closed on
Jan 7, 1999
Sold by
Willows At Chatham Llc
Bought by
Conwell Mark and Conwell Ann
Home Financials for this Owner
Home Financials are based on the most recent Mortgage that was taken out on this home.
Original Mortgage
$128,500
Interest Rate
6.7%
Create a Home Valuation Report for This Property
The Home Valuation Report is an in-depth analysis detailing your home's value as well as a comparison with similar homes in the area
Home Values in the Area
Average Home Value in this Area
Purchase History
| Date | Buyer | Sale Price | Title Company |
|---|---|---|---|
| Mensah Natalie | $197,000 | Chicago Title Insurance Co | |
| Moody Sharon S | $143,000 | Fidelity National Title Ins | |
| Conwell Mark | $142,778 | -- |
Source: Public Records
Mortgage History
| Date | Status | Borrower | Loan Amount |
|---|---|---|---|
| Open | Mensah Natalie | $191,090 | |
| Previous Owner | Moody Sharon S | $103,000 | |
| Previous Owner | Conwell Mark | $128,500 |
Source: Public Records
Tax History Compared to Growth
Tax History
| Year | Tax Paid | Tax Assessment Tax Assessment Total Assessment is a certain percentage of the fair market value that is determined by local assessors to be the total taxable value of land and additions on the property. | Land | Improvement |
|---|---|---|---|---|
| 2025 | $3,900 | $240,900 | $50,000 | $190,900 |
| 2024 | $3,744 | $240,900 | $50,000 | $190,900 |
| 2023 | $3,744 | $240,900 | $50,000 | $190,900 |
| 2022 | $3,347 | $156,600 | $30,000 | $126,600 |
| 2021 | $3,347 | $156,600 | $30,000 | $126,600 |
| 2020 | $3,318 | $156,600 | $30,000 | $126,600 |
| 2019 | $3,295 | $156,600 | $30,000 | $126,600 |
| 2018 | $3,202 | $156,600 | $30,000 | $126,600 |
| 2017 | $3,110 | $156,600 | $30,000 | $126,600 |
| 2016 | $3,029 | $156,600 | $30,000 | $126,600 |
| 2015 | $2,993 | $156,600 | $30,000 | $126,600 |
| 2014 | $2,971 | $156,600 | $30,000 | $126,600 |
Source: Public Records
Map
Nearby Homes
- 9 Schindler Ct
- 55 River Rd
- 15 Maple St
- 128 Fairmount Ave
- 20 Orchard Rd
- 84 Fairmount Ave
- 7 Carleen Ct
- 30 Aubrey St
- 169 Watchung Ave
- 21 Oak Dr
- 215 Kent Place Blvd
- 24 Greenfield Ave
- 11 Dellwood Ave
- 234 Washington Ave
- 30 Hillside Ave
- 14A Kensington Rd Unit A
- 172 Colonial Rd
- 24 Gates Ave Unit A
- 57 Parrott Mill Rd
- 166 Colonial Rd
- 36 Schindler Ct Unit ML2
- 40 Schindler Ct Unit ML4
- 38 Schindler Ct Unit ML3
- 32 Schindler Ct Unit G36
- 30 Schindler Ct Unit G35
- 21 Schindler Ct Unit C11
- 28 Schindler Ct
- 29 Schindler Ct Unit C15
- 24 Schindler Ct
- 31 Schindler Ct Unit D16
- 26 Schindler Ct
- 23 Schindler Ct Unit C12
- 25 Schindler Ct
- 27 Schindler Ct
- 17 Schindler Ct Unit B9
- 33 Schindler Ct Unit D17
- 11 Schindler Ct Unit B6
- 22 Schindler Ct Unit F31
- 15 Schindler Ct Unit B8
- 20 Schindler Ct Unit F30