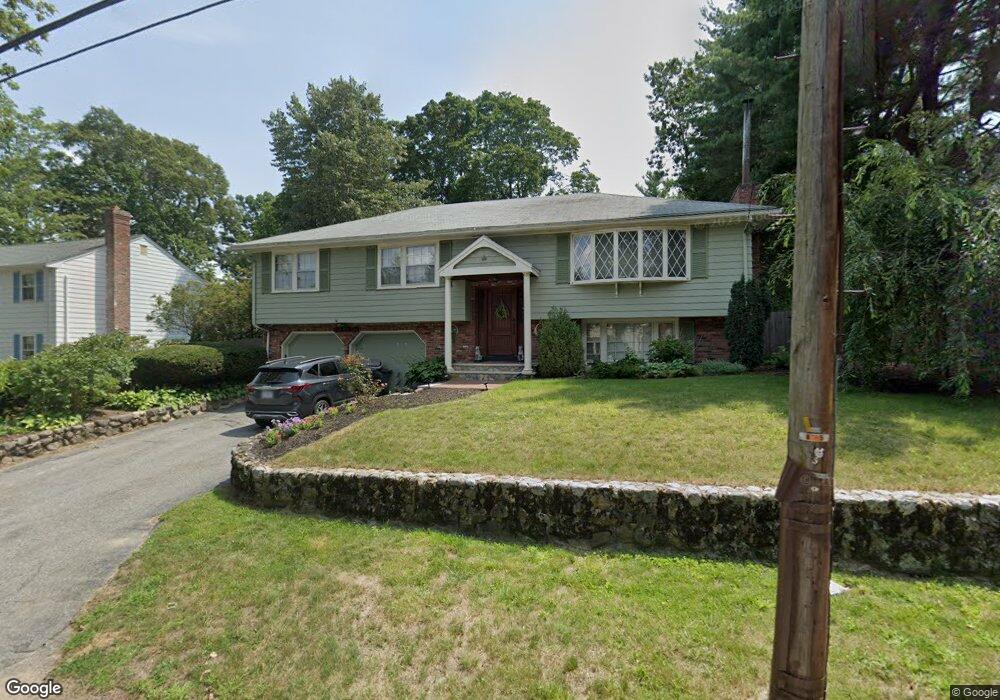
34 Scotland Rd Reading, MA 01867
Estimated Value: $936,000 - $1,069,000
3
Beds
3
Baths
1,386
Sq Ft
$727/Sq Ft
Est. Value
About This Home
This home is located at 34 Scotland Rd, Reading, MA 01867 and is currently estimated at $1,007,349, approximately $726 per square foot. 34 Scotland Rd is a home located in Middlesex County with nearby schools including Joshua Eaton Elementary School, Walter S. Parker Middle School, and Reading Memorial High School.
Ownership History
Date
Name
Owned For
Owner Type
Purchase Details
Closed on
Oct 15, 2018
Sold by
Maver John and Rountry-Maver Shannon
Bought by
34 Scotland Rd Ret and Rountry-Maver
Current Estimated Value
Purchase Details
Closed on
May 21, 2012
Sold by
Roche William and Roche Karen
Bought by
Maver John and Maver Shannon R
Home Financials for this Owner
Home Financials are based on the most recent Mortgage that was taken out on this home.
Original Mortgage
$388,800
Interest Rate
4.01%
Mortgage Type
New Conventional
Purchase Details
Closed on
Oct 30, 2007
Sold by
Obrien Catherine C Est
Bought by
Roche Karen and Roche William K
Home Financials for this Owner
Home Financials are based on the most recent Mortgage that was taken out on this home.
Original Mortgage
$340,000
Interest Rate
6.39%
Mortgage Type
Purchase Money Mortgage
Create a Home Valuation Report for This Property
The Home Valuation Report is an in-depth analysis detailing your home's value as well as a comparison with similar homes in the area
Home Values in the Area
Average Home Value in this Area
Purchase History
We collect this data history from publicly available records. To have your information removed, we recommend requesting removal directly through your county’s website.
| Date | Buyer | Sale Price | Title Company |
|---|---|---|---|
| 34 Scotland Rd Ret | -- | -- | |
| Maver John | $486,000 | -- | |
| Maver John | $486,000 | -- | |
| Roche Karen | $440,000 | -- | |
| Roche Karen | $440,000 | -- |
Source: Public Records
Mortgage History
We collect this data history from publicly available records. To have your information removed, we recommend requesting removal directly through your county’s website.
| Date | Status | Borrower | Loan Amount |
|---|---|---|---|
| Previous Owner | Maver John | $388,800 | |
| Previous Owner | Roche Karen | $340,000 |
Source: Public Records
Tax History
| Year | Tax Paid | Tax Assessment Tax Assessment Total Assessment is a certain percentage of the fair market value that is determined by local assessors to be the total taxable value of land and additions on the property. | Land | Improvement |
|---|---|---|---|---|
| 2025 | $10,269 | $901,600 | $553,600 | $348,000 |
| 2024 | $10,394 | $886,900 | $544,600 | $342,300 |
| 2023 | $9,782 | $777,000 | $477,100 | $299,900 |
| 2022 | $9,771 | $733,000 | $450,100 | $282,900 |
| 2021 | $9,373 | $678,700 | $411,800 | $266,900 |
| 2020 | $9,002 | $645,300 | $391,500 | $253,800 |
| 2019 | $8,628 | $606,300 | $367,900 | $238,400 |
| 2018 | $7,870 | $567,400 | $344,300 | $223,100 |
| 2017 | $7,805 | $556,300 | $337,500 | $218,800 |
| 2016 | $7,511 | $518,000 | $333,200 | $184,800 |
| 2015 | $6,922 | $470,900 | $302,900 | $168,000 |
| 2014 | $6,941 | $470,900 | $302,900 | $168,000 |
Source: Public Records
Map
Nearby Homes
- 115 Prescott St
- 298 Woburn St
- 152 Oak St
- 21 Buckingham Dr
- 24 Glenmere Cir
- 168 Summer Ave
- 7 King St
- 141 Pine Ridge Rd
- 295 Main St Unit 15
- 295 Main St Unit 16
- 269 Main St Unit 4001
- 33 Old Farm Rd
- 120 Summer Ave
- 400 Main St
- 16 Munroe Ave
- 11 Linden St
- 23 Augustus Ct Unit 4003
- 52 Sanborn St Unit 7
- 57 Augustus Ct Unit 1010
- 48 Village St Unit 1001
Your Personal Tour Guide
Ask me questions while you tour the home.