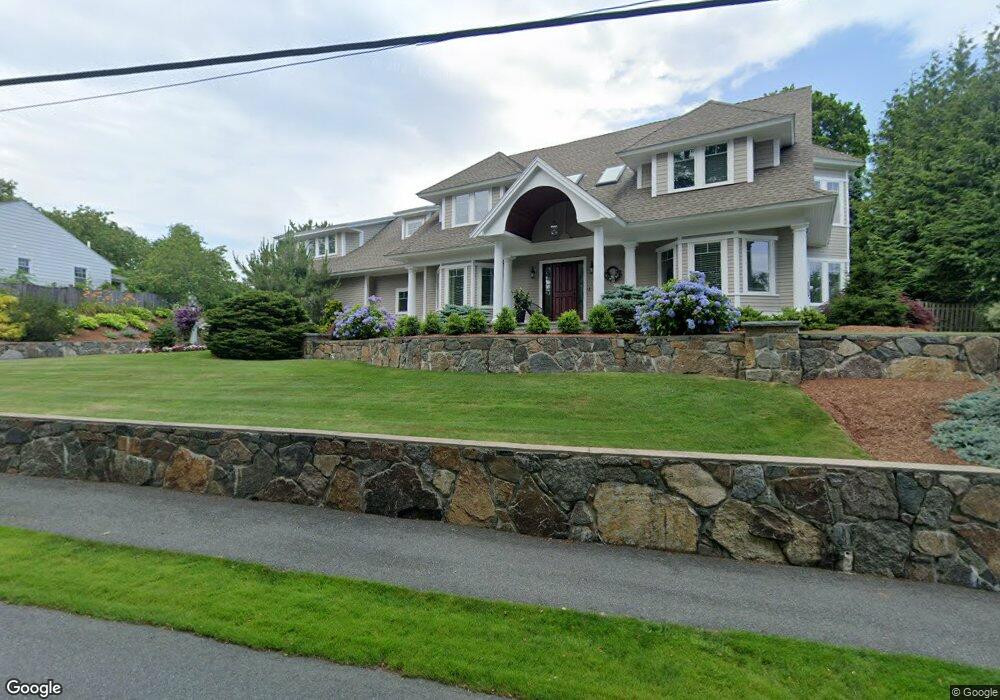
34 Seaview Ave Marblehead, MA 01945
Estimated Value: $1,641,000 - $2,075,000
3
Beds
4
Baths
4,378
Sq Ft
$418/Sq Ft
Est. Value
About This Home
This home is located at 34 Seaview Ave, Marblehead, MA 01945 and is currently estimated at $1,832,072, approximately $418 per square foot. 34 Seaview Ave is a home with nearby schools including Marblehead High School, Devereux School, and Tower School.
Ownership History
Date
Name
Owned For
Owner Type
Purchase Details
Closed on
May 12, 2015
Sold by
Costa Alberto J and Costa Maria A
Bought by
34 Seaview Avenue Rt and Costa
Current Estimated Value
Purchase Details
Closed on
Jul 31, 2006
Sold by
Caldwell Pauline C and Watson Pauline C
Bought by
Costa Alberto J
Home Financials for this Owner
Home Financials are based on the most recent Mortgage that was taken out on this home.
Original Mortgage
$280,000
Interest Rate
6.67%
Mortgage Type
Purchase Money Mortgage
Create a Home Valuation Report for This Property
The Home Valuation Report is an in-depth analysis detailing your home's value as well as a comparison with similar homes in the area
Home Values in the Area
Average Home Value in this Area
Purchase History
| Date | Buyer | Sale Price | Title Company |
|---|---|---|---|
| 34 Seaview Avenue Rt | -- | -- | |
| 34 Seaview Avenue Rt | -- | -- | |
| Costa Alberto J | $480,000 | -- | |
| Costa Alberto J | $480,000 | -- |
Source: Public Records
Mortgage History
| Date | Status | Borrower | Loan Amount |
|---|---|---|---|
| Previous Owner | Costa Alberto J | $280,000 |
Source: Public Records
Tax History
| Year | Tax Paid | Tax Assessment Tax Assessment Total Assessment is a certain percentage of the fair market value that is determined by local assessors to be the total taxable value of land and additions on the property. | Land | Improvement |
|---|---|---|---|---|
| 2025 | $15,876 | $1,754,200 | $774,600 | $979,600 |
| 2024 | $16,582 | $1,850,700 | $984,400 | $866,300 |
| 2023 | $14,853 | $1,485,300 | $718,100 | $767,200 |
| 2022 | $14,227 | $1,352,400 | $597,100 | $755,300 |
| 2021 | $13,258 | $1,272,400 | $564,800 | $707,600 |
| 2020 | $13,009 | $1,252,100 | $581,000 | $671,100 |
| 2019 | $12,927 | $1,203,600 | $532,500 | $671,100 |
| 2018 | $13,086 | $1,187,500 | $516,400 | $671,100 |
| 2017 | $12,677 | $1,151,400 | $468,000 | $683,400 |
| 2016 | $12,063 | $1,086,800 | $403,400 | $683,400 |
| 2015 | $12,208 | $1,101,800 | $371,200 | $730,600 |
| 2014 | -- | $821,700 | $338,900 | $482,800 |
Source: Public Records
Map
Nearby Homes
- 212 Humphrey St Unit 205
- 11 Angenica Terrace
- 16 Pickwick Rd
- 12 Pickwick Rd
- 2 Ocean Ave
- 4 Dean Rd
- 469 Loring Ave
- 1002 Paradise Rd Unit PHE
- 1004 Paradise Rd Unit 1K
- 1004 Paradise Rd Unit 1L
- 35 Alden Rd
- 34 Lafayette St
- 22 Hemenway Rd
- 33 W Shore Dr
- 71 Walnut Rd
- 49 Weatherly Dr
- 30 Weatherly Dr
- 11 Weatherly Dr
- 3 Didio Dr
- 10 Arbutus Rd
Your Personal Tour Guide
Ask me questions while you tour the home.