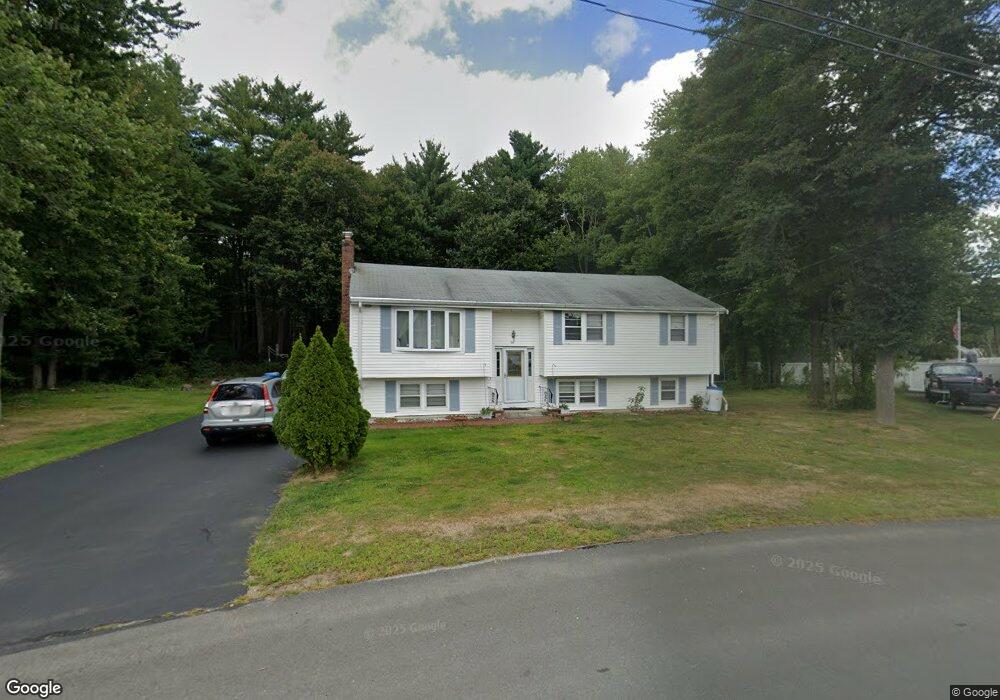
34 Shaw Rd Rockland, MA 02370
Estimated Value: $656,000 - $687,000
4
Beds
2
Baths
1,856
Sq Ft
$363/Sq Ft
Est. Value
About This Home
This home is located at 34 Shaw Rd, Rockland, MA 02370 and is currently estimated at $673,931, approximately $363 per square foot. 34 Shaw Rd is a home located in Plymouth County with nearby schools including Rockland Senior High School, Calvary Chapel Academy, and Holy Family Elementary School.
Ownership History
Date
Name
Owned For
Owner Type
Purchase Details
Closed on
Aug 29, 2025
Sold by
Lam Kathy
Bought by
Lam Kathy and Lam John
Current Estimated Value
Purchase Details
Closed on
Mar 9, 2019
Sold by
Lam Joseph
Bought by
Lam Joseph and Lam Kathy
Purchase Details
Closed on
Jun 13, 2000
Sold by
Lam Phuong Thi Bich
Bought by
Lam Luu and Nguyen Oanh
Home Financials for this Owner
Home Financials are based on the most recent Mortgage that was taken out on this home.
Original Mortgage
$178,528
Interest Rate
8.12%
Mortgage Type
Purchase Money Mortgage
Purchase Details
Closed on
Dec 3, 1996
Sold by
Murphy Dorothea M
Bought by
Lam Huong Thi-Bich
Home Financials for this Owner
Home Financials are based on the most recent Mortgage that was taken out on this home.
Original Mortgage
$100,000
Interest Rate
7.82%
Mortgage Type
Purchase Money Mortgage
Create a Home Valuation Report for This Property
The Home Valuation Report is an in-depth analysis detailing your home's value as well as a comparison with similar homes in the area
Home Values in the Area
Average Home Value in this Area
Purchase History
| Date | Buyer | Sale Price | Title Company |
|---|---|---|---|
| Lam Kathy | -- | -- | |
| Lam Joseph | -- | -- | |
| Lam Luu | $180,000 | -- | |
| Lam Huong Thi-Bich | $135,000 | -- |
Source: Public Records
Mortgage History
| Date | Status | Borrower | Loan Amount |
|---|---|---|---|
| Previous Owner | Lam Huong Thi-Bich | $178,528 | |
| Previous Owner | Lam Huong Thi-Bich | $100,000 |
Source: Public Records
Tax History Compared to Growth
Tax History
| Year | Tax Paid | Tax Assessment Tax Assessment Total Assessment is a certain percentage of the fair market value that is determined by local assessors to be the total taxable value of land and additions on the property. | Land | Improvement |
|---|---|---|---|---|
| 2025 | $7,729 | $565,400 | $235,100 | $330,300 |
| 2024 | $7,563 | $537,900 | $221,800 | $316,100 |
| 2023 | $7,312 | $480,400 | $203,400 | $277,000 |
| 2022 | $7,058 | $421,400 | $176,900 | $244,500 |
| 2021 | $6,449 | $373,200 | $160,800 | $212,400 |
| 2020 | $6,225 | $355,700 | $153,200 | $202,500 |
| 2019 | $6,120 | $341,500 | $145,900 | $195,600 |
| 2018 | $450 | $325,200 | $145,900 | $179,300 |
| 2017 | $5,720 | $309,500 | $145,900 | $163,600 |
| 2016 | $5,458 | $295,200 | $140,300 | $154,900 |
| 2015 | $5,210 | $273,800 | $131,100 | $142,700 |
| 2014 | $4,924 | $268,500 | $128,600 | $139,900 |
Source: Public Records
Map
Nearby Homes
- 810 Brookline Way
- 19 Pat Rose Way
- 8 Pat Rose Way
- 6 Pat Rose Way
- 17 Pat Rose Way
- 20 Pat Rose Way
- 696 Summer St
- 86 Damon Rd
- 149 Concord St
- 38 Levin Rd
- 718 Market St
- 133 Spring St
- 14 Daniel Teague Dr
- 440 Market St
- 49 Liberty St
- 133 Crescent St
- 92 Liberty St
- 94-96 Crescent St
- 140 W Water St
- 12 Linden St