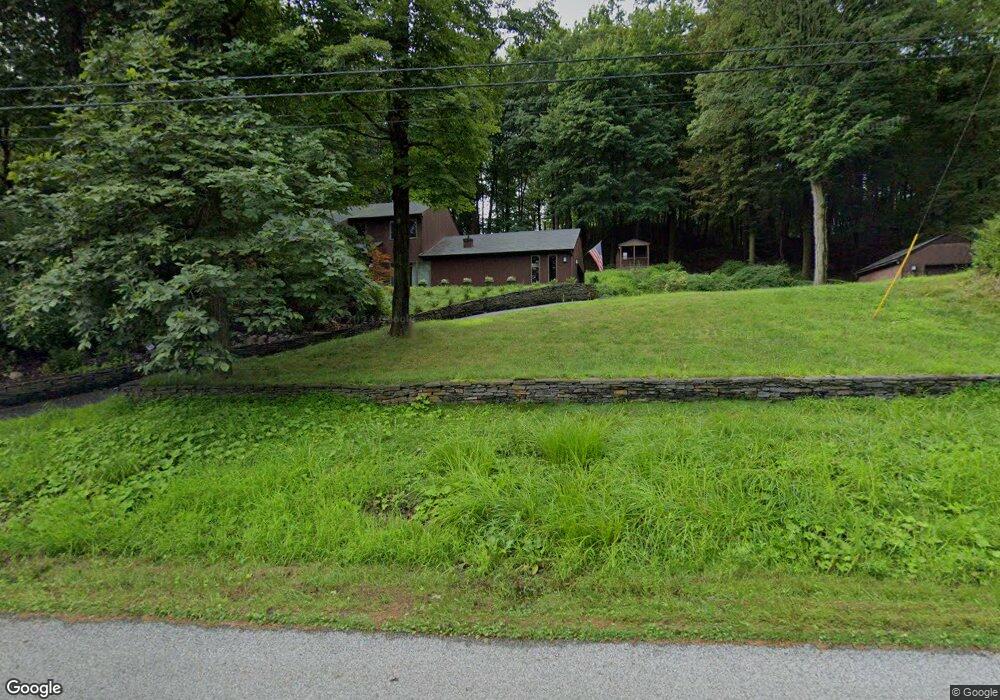
34 Shore Rd Cornwall On Hudson, NY 12520
Estimated Value: $595,000 - $739,000
3
Beds
3
Baths
2,180
Sq Ft
$304/Sq Ft
Est. Value
About This Home
This home is located at 34 Shore Rd, Cornwall On Hudson, NY 12520 and is currently estimated at $662,684, approximately $303 per square foot. 34 Shore Rd is a home located in Orange County with nearby schools including Cornwall Central Middle School, Little Harvard, and San Miguel Academy Of Newburgh.
Ownership History
Date
Name
Owned For
Owner Type
Purchase Details
Closed on
Apr 1, 2025
Sold by
Harbison Jon N and Harbison Janka
Bought by
Harbison Jon N
Current Estimated Value
Home Financials for this Owner
Home Financials are based on the most recent Mortgage that was taken out on this home.
Original Mortgage
$179,000
Outstanding Balance
$178,202
Interest Rate
6.63%
Mortgage Type
New Conventional
Estimated Equity
$484,482
Purchase Details
Closed on
May 7, 2014
Sold by
Harbison Jon
Bought by
Harbison Jon
Purchase Details
Closed on
Aug 30, 1996
Sold by
Desjardins Guy and Desjardins Maria
Bought by
Harbison Jon S
Create a Home Valuation Report for This Property
The Home Valuation Report is an in-depth analysis detailing your home's value as well as a comparison with similar homes in the area
Home Values in the Area
Average Home Value in this Area
Purchase History
| Date | Buyer | Sale Price | Title Company |
|---|---|---|---|
| Harbison Jon N | -- | None Available | |
| Harbison Jon | -- | -- | |
| Harbison Jon | -- | -- | |
| Harbison Jon S | $170,000 | -- | |
| Harbison Jon S | $170,000 | -- |
Source: Public Records
Mortgage History
| Date | Status | Borrower | Loan Amount |
|---|---|---|---|
| Open | Harbison Jon N | $179,000 |
Source: Public Records
Tax History Compared to Growth
Tax History
| Year | Tax Paid | Tax Assessment Tax Assessment Total Assessment is a certain percentage of the fair market value that is determined by local assessors to be the total taxable value of land and additions on the property. | Land | Improvement |
|---|---|---|---|---|
| 2024 | $13,464 | $335,000 | $136,100 | $198,900 |
| 2023 | $13,464 | $335,000 | $136,100 | $198,900 |
| 2022 | $13,365 | $335,000 | $136,100 | $198,900 |
| 2021 | $10,585 | $335,000 | $136,100 | $198,900 |
| 2020 | $8,745 | $335,000 | $136,100 | $198,900 |
| 2019 | $9,629 | $335,000 | $136,100 | $198,900 |
| 2018 | $9,629 | $335,000 | $136,100 | $198,900 |
| 2017 | $9,473 | $335,000 | $136,100 | $198,900 |
| 2016 | $10,244 | $252,200 | $58,500 | $193,700 |
| 2015 | -- | $252,200 | $58,500 | $193,700 |
| 2014 | -- | $252,200 | $58,500 | $193,700 |
Source: Public Records
Map
Nearby Homes