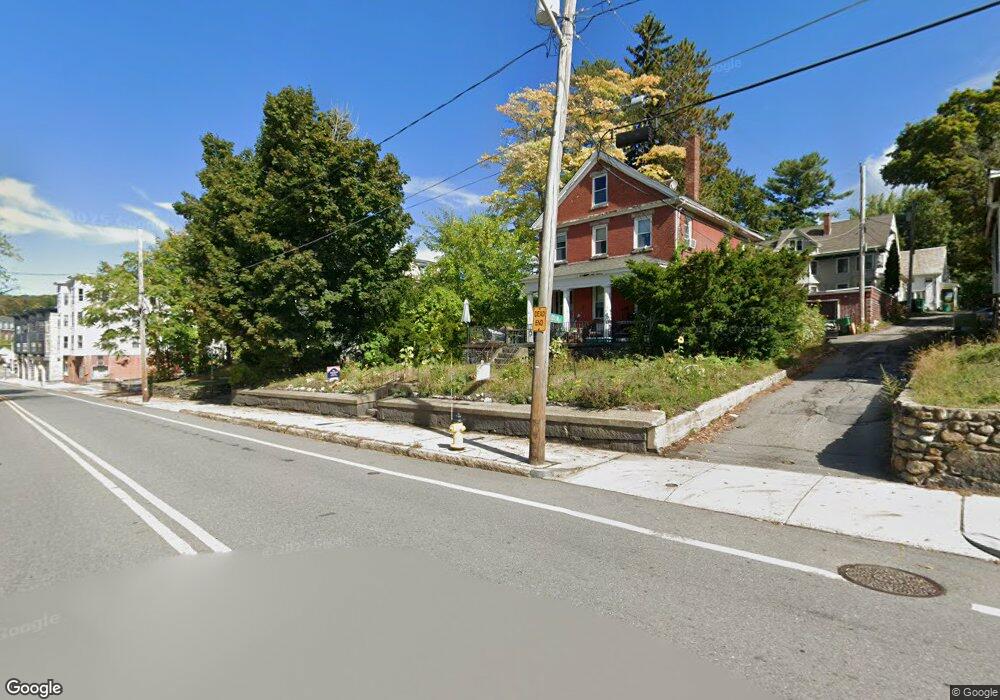
34 Summer St Fitchburg, MA 01420
Estimated Value: $378,000 - $465,000
7
Beds
3
Baths
2,480
Sq Ft
$169/Sq Ft
Est. Value
About This Home
This home is located at 34 Summer St, Fitchburg, MA 01420 and is currently estimated at $418,196, approximately $168 per square foot. 34 Summer St is a home located in Worcester County with nearby schools including South Street Elementary School, Crocker Elementary School, and Reingold Elementary School.
Ownership History
Date
Name
Owned For
Owner Type
Purchase Details
Closed on
Sep 8, 2014
Sold by
34 Summer Street Rt and Willoughby
Bought by
Willoughby Mary E and Willoughby Bruce
Current Estimated Value
Purchase Details
Closed on
Nov 4, 2013
Sold by
Willoughby Bruce and Willoughby Mary E
Bought by
34 Summer Street Rt and Willoughby
Purchase Details
Closed on
Feb 24, 2009
Sold by
Oneil Cathleen and Oneil Herbert L
Bought by
Willoughby Mary Evelyn and Willoughby Bruce
Create a Home Valuation Report for This Property
The Home Valuation Report is an in-depth analysis detailing your home's value as well as a comparison with similar homes in the area
Home Values in the Area
Average Home Value in this Area
Purchase History
| Date | Buyer | Sale Price | Title Company |
|---|---|---|---|
| Willoughby Mary E | -- | -- | |
| 34 Summer Street Rt | -- | -- | |
| Willoughby Mary Evelyn | $100,000 | -- |
Source: Public Records
Tax History Compared to Growth
Tax History
| Year | Tax Paid | Tax Assessment Tax Assessment Total Assessment is a certain percentage of the fair market value that is determined by local assessors to be the total taxable value of land and additions on the property. | Land | Improvement |
|---|---|---|---|---|
| 2025 | $42 | $311,100 | $88,100 | $223,000 |
| 2024 | $4,314 | $291,300 | $55,100 | $236,200 |
| 2023 | $4,108 | $256,400 | $42,300 | $214,100 |
| 2022 | $4,019 | $228,200 | $37,100 | $191,100 |
| 2021 | $3,728 | $195,900 | $28,200 | $167,700 |
| 2020 | $3,954 | $200,600 | $23,000 | $177,600 |
| 2019 | $3,317 | $161,900 | $32,000 | $129,900 |
| 2018 | $3,049 | $145,100 | $29,500 | $115,600 |
| 2017 | $2,920 | $135,900 | $26,900 | $109,000 |
| 2016 | $2,898 | $136,500 | $26,900 | $109,600 |
| 2015 | $2,990 | $144,600 | $28,200 | $116,400 |
| 2014 | $2,929 | $147,700 | $28,200 | $119,500 |
Source: Public Records
Map
Nearby Homes
- 15-25 Lunenburg St
- 11 Oak St
- 4 Brigham Park
- 29 Brigham Park
- 35 Winter St
- 1 Avon Place
- 80 Highland Ave
- 87 Summer St
- 25 Railroad St
- 56 Orange St
- 55 Brier St Unit 55
- 6 Boylston St
- 112 Boutelle St
- 183-185 Boutelle St
- 38-44 Granite St
- 168 Lunenburg St
- 36 Jackson Ave
- 19 Boylston St
- 46 Jackson Ave
- 156 Summer St