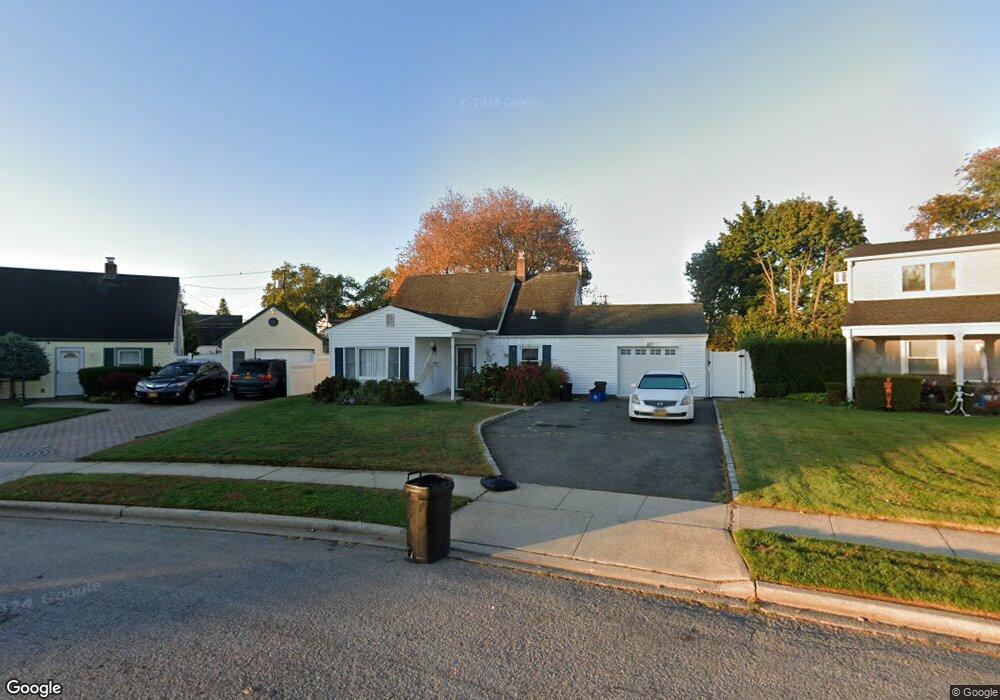
34 Surrey Ln Levittown, NY 11756
Estimated Value: $785,000 - $815,934
5
Beds
3
Baths
1,774
Sq Ft
$451/Sq Ft
Est. Value
About This Home
This home is located at 34 Surrey Ln, Levittown, NY 11756 and is currently estimated at $800,467, approximately $451 per square foot. 34 Surrey Ln is a home located in Nassau County with nearby schools including J Fred Sparke Elementary School, Michael F. Stokes Elementary School, and Island Trees Middle School.
Ownership History
Date
Name
Owned For
Owner Type
Purchase Details
Closed on
Jun 16, 2017
Sold by
Cooper William
Bought by
Filippazzo Stephanie and Higgins Matthew
Current Estimated Value
Home Financials for this Owner
Home Financials are based on the most recent Mortgage that was taken out on this home.
Original Mortgage
$346,000
Outstanding Balance
$235,952
Interest Rate
4.05%
Mortgage Type
New Conventional
Estimated Equity
$564,515
Purchase Details
Closed on
Aug 27, 2004
Sold by
Hertz Steven
Bought by
Bretana Rae
Create a Home Valuation Report for This Property
The Home Valuation Report is an in-depth analysis detailing your home's value as well as a comparison with similar homes in the area
Home Values in the Area
Average Home Value in this Area
Purchase History
| Date | Buyer | Sale Price | Title Company |
|---|---|---|---|
| Filippazzo Stephanie | $432,500 | Westcor Land Title Insurance | |
| Bretana Rae | $365,000 | -- |
Source: Public Records
Mortgage History
| Date | Status | Borrower | Loan Amount |
|---|---|---|---|
| Open | Filippazzo Stephanie | $346,000 |
Source: Public Records
Tax History Compared to Growth
Tax History
| Year | Tax Paid | Tax Assessment Tax Assessment Total Assessment is a certain percentage of the fair market value that is determined by local assessors to be the total taxable value of land and additions on the property. | Land | Improvement |
|---|---|---|---|---|
| 2025 | $12,488 | $511 | $312 | $199 |
| 2024 | $4,217 | $511 | $312 | $199 |
Source: Public Records
Map
Nearby Homes