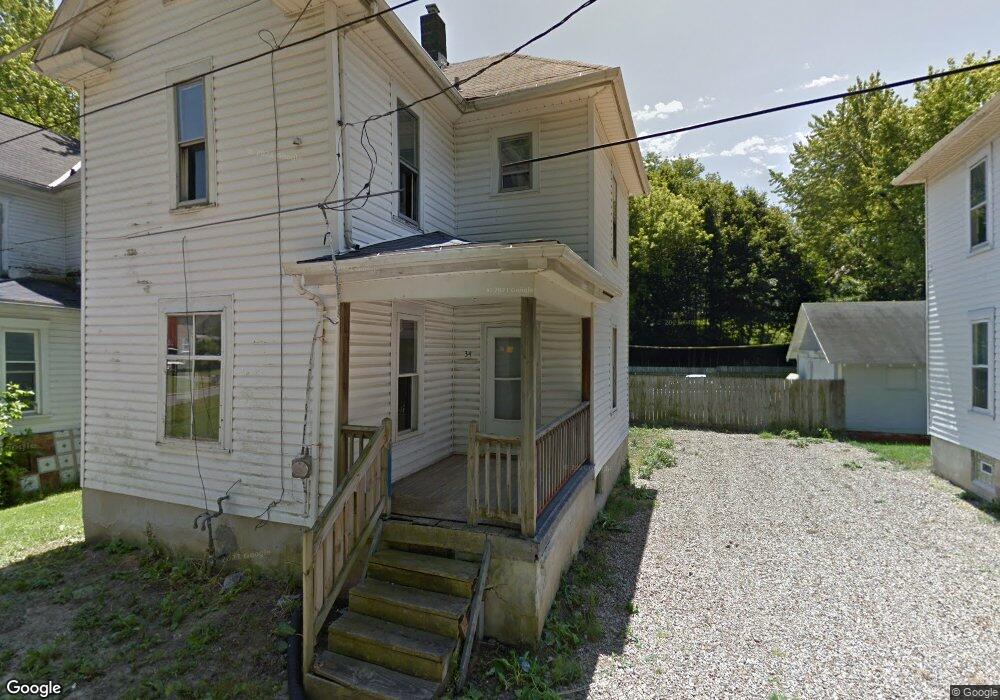
34 Swanger Ave Mansfield, OH 44902
Estimated Value: $55,000 - $81,000
3
Beds
1
Bath
1,088
Sq Ft
$61/Sq Ft
Est. Value
About This Home
This home is located at 34 Swanger Ave, Mansfield, OH 44902 and is currently estimated at $66,501, approximately $61 per square foot. 34 Swanger Ave is a home located in Richland County with nearby schools including St. Peter's Elementary/Montessori School, St. Peter's High School/Junior High, and Discovery School.
Ownership History
Date
Name
Owned For
Owner Type
Purchase Details
Closed on
Apr 27, 2011
Sold by
Fannie Mae
Bought by
Stoffer Scott M
Current Estimated Value
Purchase Details
Closed on
Feb 18, 2011
Sold by
Glowski Norbert
Bought by
Federal National Mortgage Association
Purchase Details
Closed on
Jun 13, 2003
Sold by
Glowski Norbert F
Bought by
Glowski Norbert F and Glowski Stella
Home Financials for this Owner
Home Financials are based on the most recent Mortgage that was taken out on this home.
Original Mortgage
$40,000
Interest Rate
5.78%
Mortgage Type
Purchase Money Mortgage
Purchase Details
Closed on
Jan 12, 2000
Sold by
Wilson Paul G
Bought by
Glowski Norbert F
Purchase Details
Closed on
Dec 11, 1992
Sold by
Caravella Gale Diane
Bought by
Caravella Gale Diane
Purchase Details
Closed on
Sep 9, 1992
Sold by
Pierce Doris E
Bought by
Caravella Gale Diane
Create a Home Valuation Report for This Property
The Home Valuation Report is an in-depth analysis detailing your home's value as well as a comparison with similar homes in the area
Home Values in the Area
Average Home Value in this Area
Purchase History
| Date | Buyer | Sale Price | Title Company |
|---|---|---|---|
| Stoffer Scott M | $5,500 | Southern Title | |
| Federal National Mortgage Association | $6,000 | None Available | |
| Glowski Norbert F | -- | Titleco Title Agency | |
| Glowski Norbert F | $30,000 | -- | |
| Caravella Gale Diane | $6,300 | -- | |
| Caravella Gale Diane | -- | -- |
Source: Public Records
Mortgage History
| Date | Status | Borrower | Loan Amount |
|---|---|---|---|
| Previous Owner | Glowski Norbert F | $40,000 |
Source: Public Records
Tax History Compared to Growth
Tax History
| Year | Tax Paid | Tax Assessment Tax Assessment Total Assessment is a certain percentage of the fair market value that is determined by local assessors to be the total taxable value of land and additions on the property. | Land | Improvement |
|---|---|---|---|---|
| 2024 | $124 | $2,580 | $1,400 | $1,180 |
| 2023 | $124 | $2,580 | $1,400 | $1,180 |
| 2022 | $130 | $2,280 | $1,350 | $930 |
| 2021 | $131 | $2,280 | $1,350 | $930 |
| 2020 | $134 | $2,280 | $1,350 | $930 |
| 2019 | $126 | $1,930 | $1,140 | $790 |
| 2018 | $124 | $1,930 | $1,140 | $790 |
| 2017 | $175 | $3,870 | $1,140 | $2,730 |
| 2016 | $108 | $1,670 | $750 | $920 |
| 2015 | $103 | $1,670 | $750 | $920 |
| 2014 | $102 | $1,670 | $750 | $920 |
| 2012 | $82 | $1,750 | $780 | $970 |
Source: Public Records
Map
Nearby Homes
- 259 S Main St
- 286 S Main St
- 327 Hammond Ave
- 319 Altamont Ave
- 212 S Main St
- 137 Lexington Ave
- 394 S Main St
- 186 S Mulberry St
- 175 S Mulberry St
- 96 Glenwood Heights
- 172 -172 1 2 Lexington Ave
- 120 Grover St
- 0 N Adams St
- 353 Sturges Ave
- 69 Reba Ave
- 0 Cline Ave Hedeen Abbeyfeale Unit 9066362
- 519 S Diamond St
- 131 Sturges Ave
- 430 Beethoven St
- 305 Home Ave
- 38 Swanger Ave
- 32 Swanger Ave
- 280 Hammond Ave
- 33 Swanger Ave
- 24 Swanger Ave
- 35 Swanger Ave
- 37 Swanger Ave
- 29 Swanger Ave
- 25 Swanger Ave
- 279 Hammond Ave
- 16 Swanger Ave
- 41 Granite St
- 269 Hammond Ave
- 275 Hammond Ave
- 21 Swanger Ave
- 273 Hammond Ave
- 25 Granite St
- 31 Granite St Unit 35
- 285 Hammond Ave
- 27 Granite St