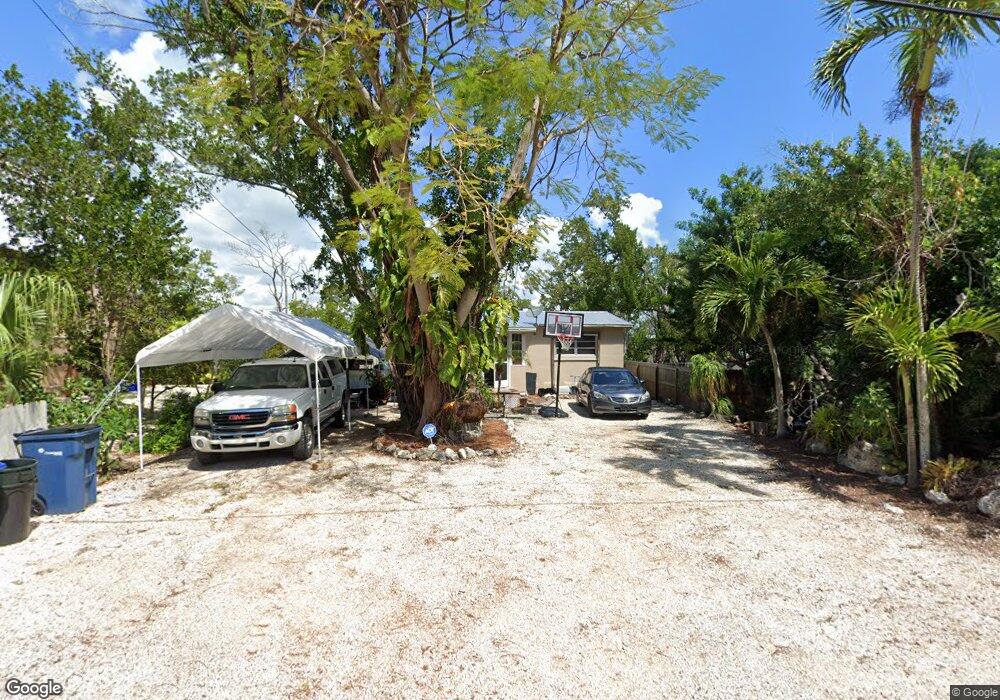
34 Tarpon Ave Key Largo, FL 33037
Estimated Value: $489,855 - $673,000
2
Beds
1
Bath
1,040
Sq Ft
$579/Sq Ft
Est. Value
About This Home
This home is located at 34 Tarpon Ave, Key Largo, FL 33037 and is currently estimated at $601,964, approximately $578 per square foot. 34 Tarpon Ave is a home located in Monroe County with nearby schools including Key Largo School, Coral Shores High School, and St. Justin Marine Academy.
Ownership History
Date
Name
Owned For
Owner Type
Purchase Details
Closed on
Dec 16, 2003
Sold by
Finch Thomas Marion and Finch Jennifer Lyn
Bought by
Finch Jennifer Lyn and Kvadus Jennifer Lyn
Current Estimated Value
Home Financials for this Owner
Home Financials are based on the most recent Mortgage that was taken out on this home.
Original Mortgage
$129,500
Outstanding Balance
$59,410
Interest Rate
5.85%
Mortgage Type
New Conventional
Estimated Equity
$542,554
Purchase Details
Closed on
Oct 27, 1998
Sold by
Finch Thomas M and Finch K
Bought by
Finch Thomas M and Finch Jennifer K
Purchase Details
Closed on
Jul 25, 1997
Sold by
Carl and Rush Carla Rush
Bought by
Finch Thomas M and Kvadus Jennifer L
Home Financials for this Owner
Home Financials are based on the most recent Mortgage that was taken out on this home.
Original Mortgage
$7,000
Interest Rate
7.7%
Mortgage Type
Balloon
Purchase Details
Closed on
Oct 1, 1987
Bought by
Paul Jennifer Lyn
Purchase Details
Closed on
Dec 1, 1978
Bought by
Paul Jennifer Lyn
Create a Home Valuation Report for This Property
The Home Valuation Report is an in-depth analysis detailing your home's value as well as a comparison with similar homes in the area
Purchase History
We collect this data history from publicly available records. To have your information removed, we recommend requesting removal directly through your county’s website.
| Date | Buyer | Sale Price | Title Company |
|---|---|---|---|
| Finch Jennifer Lyn | -- | -- | |
| Finch Thomas M | $100 | -- | |
| Finch Thomas M | $95,000 | -- | |
| Paul Jennifer Lyn | $59,000 | -- | |
| Paul Jennifer Lyn | $32,000 | -- |
Source: Public Records
Mortgage History
We collect this data history from publicly available records. To have your information removed, we recommend requesting removal directly through your county’s website.
| Date | Status | Borrower | Loan Amount |
|---|---|---|---|
| Open | Finch Thomas M | $129,500 | |
| Closed | Finch Jennifer Lyn | $129,500 | |
| Previous Owner | Finch Thomas M | $7,000 |
Source: Public Records
Tax History
| Year | Tax Paid | Tax Assessment Tax Assessment Total Assessment is a certain percentage of the fair market value that is determined by local assessors to be the total taxable value of land and additions on the property. | Land | Improvement |
|---|---|---|---|---|
| 2025 | $1,513 | $130,929 | -- | -- |
| 2024 | $1,404 | $127,240 | -- | -- |
| 2023 | $1,404 | $123,534 | $0 | $0 |
| 2022 | $1,353 | $119,936 | $0 | $0 |
| 2021 | $1,341 | $116,443 | $0 | $0 |
| 2020 | $1,336 | $114,836 | $0 | $0 |
| 2019 | $1,318 | $112,255 | $0 | $0 |
| 2018 | $1,309 | $110,162 | $0 | $0 |
| 2017 | $1,286 | $107,897 | $0 | $0 |
| 2016 | $1,295 | $105,678 | $0 | $0 |
| 2015 | $1,323 | $104,943 | $0 | $0 |
| 2014 | $1,351 | $104,110 | $0 | $0 |
Source: Public Records
Map
Nearby Homes
- 0 Tarpon Ave Unit 602928
- 0 Tarpon Ave Unit 521682
- 0 Tarpon Ave Unit 519594
- 0 Tarpon Ave Unit 550045
- 0 Tarpon Ave Unit 553198
- 0 Tarpon Ave Unit 553199
- 0 Tarpon Ave Unit 553290
- 0 Tarpon Ave Unit 553916
- 0 Tarpon Ave Unit 553915
- 0 Tarpon Ave Unit Vacant Land 561691
- 00 Tarpon Ave
- 0 Tarpon Ave
- 29 Tarpon Ave
- 36 Tarpon Ave
- 23 Tarpon Ave
- 31 Tarpon Ave
- 33 Tarpon Ave
- 20 N Marlin Ave
- 20 N Marlin Ave
- 16 N Marlin Ave
Your Personal Tour Guide
Ask me questions while you tour the home.