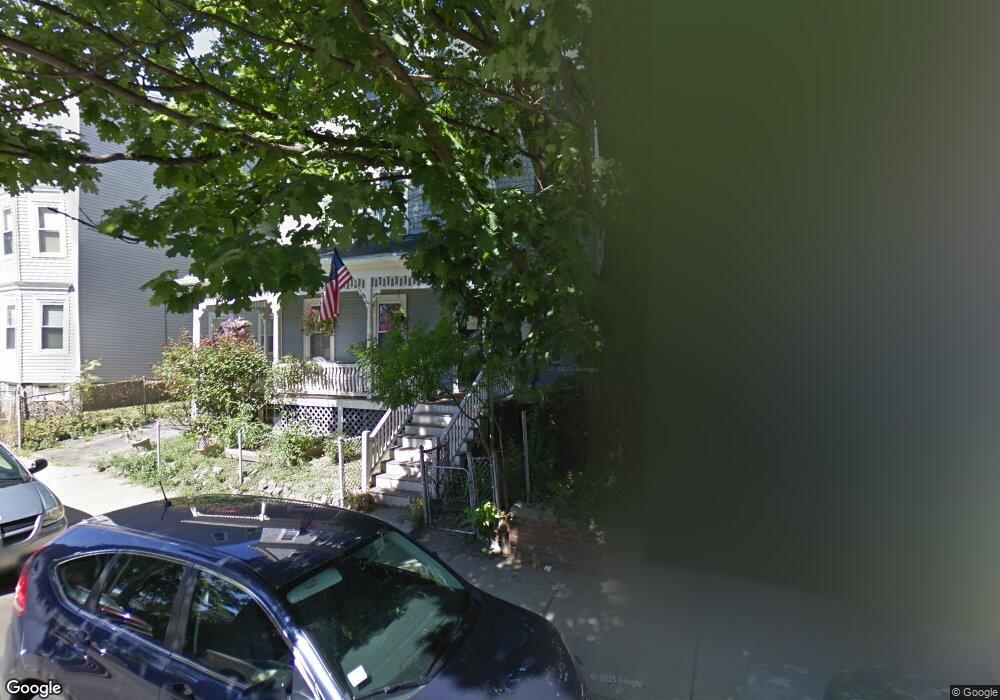
34 Tuttle St Dorchester, MA 02125
Savin Hill NeighborhoodEstimated Value: $1,044,000 - $1,156,000
About This Home
This home is located at 34 Tuttle St, Dorchester, MA 02125 and is currently estimated at $1,100,622, approximately $440 per square foot. 34 Tuttle St is a home located in Suffolk County with nearby schools including Boston Collegiate Charter School, Helen Y. Davis Leadership Academy Charter Public School, and Pope John Paul II Catholic Academy Columbia Campus.
Ownership History
We collect this data history from publicly available records. To have your information removed, we recommend requesting removal directly through your county’s website.
Purchase Details
Home Financials for this Owner
Home Financials are based on the most recent Mortgage that was taken out on this home.Purchase Details
Purchase Details
Home Values in the Area
Average Home Value in this Area
Purchase History
We collect this data history from publicly available records. To have your information removed, we recommend requesting removal directly through your county’s website.
| Date | Buyer | Sale Price | Title Company |
|---|---|---|---|
| $566,150 | -- | ||
| $199,000 | -- | ||
| $121,000 | -- |
Mortgage History
We collect this data history from publicly available records. To have your information removed, we recommend requesting removal directly through your county’s website.
| Date | Status | Borrower | Loan Amount |
|---|---|---|---|
| Open | $359,650 | ||
| Previous Owner | $261,000 | ||
| Previous Owner | $30,000 |
Tax History
We collect this data history from publicly available records. To have your information removed, we recommend requesting removal directly through your county’s website.
| Year | Tax Paid | Tax Assessment Tax Assessment Total Assessment is a certain percentage of the fair market value that is determined by local assessors to be the total taxable value of land and additions on the property. | Land | Improvement |
|---|---|---|---|---|
| 2025 | $11,219 | $968,800 | $259,000 | $709,800 |
| 2024 | $10,595 | $972,000 | $204,600 | $767,400 |
| 2023 | $9,666 | $900,000 | $189,400 | $710,600 |
| 2022 | $9,792 | $900,000 | $189,400 | $710,600 |
| 2021 | $9,029 | $846,200 | $180,400 | $665,800 |
| 2020 | $7,220 | $683,700 | $187,100 | $496,600 |
| 2019 | $6,733 | $638,800 | $135,000 | $503,800 |
| 2018 | $6,085 | $580,600 | $135,000 | $445,600 |
| 2017 | $5,589 | $527,800 | $135,000 | $392,800 |
| 2016 | $5,426 | $493,300 | $135,000 | $358,300 |
| 2015 | $5,200 | $429,400 | $101,500 | $327,900 |
| 2014 | $4,814 | $382,700 | $101,500 | $281,200 |
Map
- 4 Saxton St
- 46 Saxton St
- 10-14 Sydney St Unit 8
- 9 Sydney St Unit 2
- 72 Tuttle St Unit 1
- 79 Saxton St
- 71 Romsey St Unit 1
- 42 Grampian Way
- 136 Sydney St Unit 5
- 57 Grampian Way Unit 2
- 79 Pleasant St
- 27 Thornley St Unit 2
- 5 Caspian Way Unit 2
- 45 Pearl St Unit 3
- 142 Pleasant St
- 8 Taft St Unit 1
- 35 Newport St
- 14 Harbor View St Unit 1
- 18 Peverell St
- 145 Stoughton St Unit 4
- 36 Tuttle St
- 30 Tuttle St Unit 3
- 30 Tuttle St Unit 2
- 30 Tuttle St Unit 1
- 30 Tuttle St
- 23 Saxton St
- 23 Saxton St
- 23 Saxton St Unit 1
- 23 Saxton St Unit 2
- 23 Saxton St Unit 3
- 20 Tuttle St
- 38 Tuttle St Unit 2
- 38 Tuttle St
- 27 Saxton St
- 27 Saxton St Unit R
- 27 Saxton St Unit 1
- 27 Saxton St Unit 2
- 27 & 27R Saxton St
- 21 Saxton St
- 31 Saxton St
Ask me questions while you tour the home.