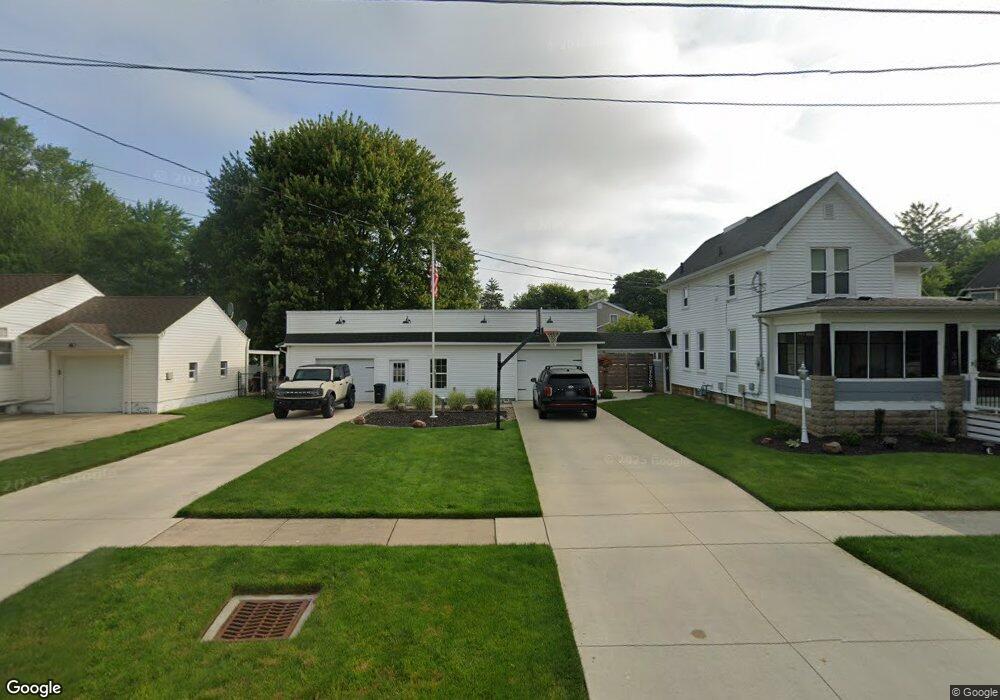
34 W Chestnut St Norwalk, OH 44857
Estimated Value: $170,000 - $297,000
4
Beds
2
Baths
1,590
Sq Ft
$129/Sq Ft
Est. Value
About This Home
This home is located at 34 W Chestnut St, Norwalk, OH 44857 and is currently estimated at $204,728, approximately $128 per square foot. 34 W Chestnut St is a home located in Huron County with nearby schools including Maplehurst Elementary School, Pleasant Elementary School, and League Elementary School.
Ownership History
Date
Name
Owned For
Owner Type
Purchase Details
Closed on
Jun 30, 2021
Sold by
Maurer Ellen and Maurer Raymond E
Bought by
Maurer Jason E and Maurer Carolyn M
Current Estimated Value
Home Financials for this Owner
Home Financials are based on the most recent Mortgage that was taken out on this home.
Original Mortgage
$118,000
Outstanding Balance
$107,761
Interest Rate
2.9%
Mortgage Type
Purchase Money Mortgage
Estimated Equity
$96,967
Purchase Details
Closed on
Jan 7, 2005
Bought by
Maurer Ellen
Purchase Details
Closed on
Aug 10, 2004
Bought by
Secretary Of Veterans
Purchase Details
Closed on
Oct 12, 2001
Sold by
Fisher James P
Bought by
Lynch Harold S
Purchase Details
Closed on
Sep 13, 2000
Bought by
Ott Jeanne A
Purchase Details
Closed on
Aug 28, 2000
Bought by
Fisher June E
Purchase Details
Closed on
Nov 26, 1985
Bought by
Fisher John R and Fisher June E
Create a Home Valuation Report for This Property
The Home Valuation Report is an in-depth analysis detailing your home's value as well as a comparison with similar homes in the area
Home Values in the Area
Average Home Value in this Area
Purchase History
| Date | Buyer | Sale Price | Title Company |
|---|---|---|---|
| Maurer Jason E | $118,000 | First American | |
| Maurer Ellen | $89,400 | -- | |
| Secretary Of Veterans | -- | -- | |
| Lynch Harold S | $89,300 | -- | |
| Ott Jeanne A | -- | -- | |
| Fisher June E | -- | -- | |
| Fisher John R | $35,000 | -- |
Source: Public Records
Mortgage History
| Date | Status | Borrower | Loan Amount |
|---|---|---|---|
| Open | Maurer Jason E | $118,000 |
Source: Public Records
Tax History Compared to Growth
Tax History
| Year | Tax Paid | Tax Assessment Tax Assessment Total Assessment is a certain percentage of the fair market value that is determined by local assessors to be the total taxable value of land and additions on the property. | Land | Improvement |
|---|---|---|---|---|
| 2024 | $2,190 | $53,580 | $11,330 | $42,250 |
| 2023 | $2,190 | $41,860 | $8,820 | $33,040 |
| 2022 | $1,689 | $41,860 | $8,820 | $33,040 |
| 2021 | $1,690 | $41,860 | $8,820 | $33,040 |
| 2020 | $1,715 | $39,630 | $7,310 | $32,320 |
| 2019 | $1,679 | $39,630 | $7,310 | $32,320 |
| 2018 | $1,650 | $39,630 | $7,310 | $32,320 |
| 2017 | $1,539 | $36,780 | $7,310 | $29,470 |
| 2016 | $1,511 | $36,780 | $7,310 | $29,470 |
| 2015 | $1,510 | $36,780 | $7,310 | $29,470 |
| 2014 | $1,442 | $34,800 | $7,320 | $27,480 |
| 2013 | $1,364 | $34,800 | $7,320 | $27,480 |
Source: Public Records
Map
Nearby Homes
- 40 Norwood Ave
- 15 W Chestnut St
- 21 Maple St
- 29 Harris Ave
- 29 W Seminary St
- 58 E Elm St
- 12 Minard Place
- 85 Woodlawn Ave
- 14 Corwin St
- 29 Corwin St
- 157 W Main St
- 37 S Garden St
- 123 E Main St
- 120 Woodlawn Ave
- 57 Milan Ave
- 15 E Washington St
- 102 N Pleasant St
- 167 Whittlesey Ave
- 253 W Main St
- 13 Spring St